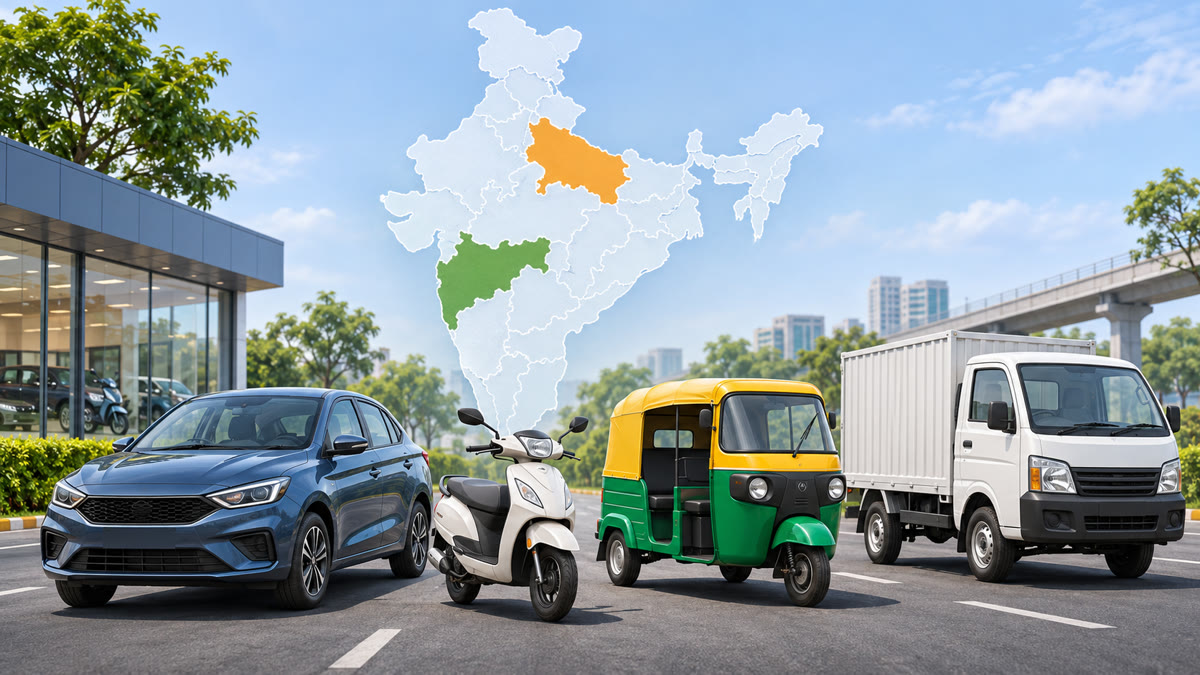
SIAM’s state-wise Q2 FY27 data shows Maharashtra was India’s biggest passenger-vehicle and commercial-vehicle market between July and September 2026, while Uttar Pradesh led two- and three-wheeler sales. The split matters beyond industry rankings: it shows where car, bike, auto-rickshaw and fleet demand was concentrated, and gives buyers and operators a clearer starting point for checking running costs.
Key takeaways
- The four segments recorded 83,87,934 domestic sales in Q2 FY27, or about 83.88 lakh units after adding SIAM’s segment totals for July–September 2026.
- Maharashtra led passenger vehicles with 1.65 lakh units, or 12.1% of India’s total, and commercial vehicles with about 0.46 lakh units, or 15%.
- Uttar Pradesh led two-wheelers with 7.89 lakh units, or 12.3%, and three-wheelers with about 0.34 lakh units, or 12.1%.
- The Western Zone led two-wheeler sales at 21.13 lakh units and passenger-vehicle sales at 4.29 lakh units during the quarter.
The Q2 FY27 vehicle-sales snapshot
The Society of Indian Automobile Manufacturers’ official Q2 release puts domestic passenger-vehicle sales at 13,60,687 units in July–September 2026. Commercial vehicles reached 3,09,063 units, three-wheelers 2,85,342 units and two-wheelers 64,32,842 units. Those four totals add up to 83,87,934 vehicles, although the categories cover very different uses and should not be read as one comparable buyer market.
| Category | India total | Leading state | Leading-state result |
|---|---|---|---|
| Passenger vehicles | 13,60,687 | Maharashtra | 1.65 lakh, 12.1% |
| Commercial vehicles | 3,09,063 | Maharashtra | About 0.46 lakh, 15% |
| Two-wheelers | 64,32,842 | Uttar Pradesh | 7.89 lakh, 12.3% |
| Three-wheelers | 2,85,342 | Uttar Pradesh | About 0.34 lakh, 12.1% |
SIAM also reported that Q2 passenger-vehicle sales grew 30.7% year on year, commercial vehicles 28.7%, three-wheelers 23.6% and two-wheelers 15.2%. The percentages compare July–September 2026 with the same quarter of the previous financial year, so they describe growth from a particular base rather than a guarantee that every state or model saw the same increase.
Where each vehicle category was strongest
Maharashtra led passenger and commercial vehicles
The state-wise data reported on 18 November puts Maharashtra at the top of the passenger-vehicle table with 1.65 lakh units, equal to 12.1% of the 13.61 lakh national total. Uttar Pradesh followed with 9.8%, Gujarat with 8.3%, Tamil Nadu with 7.7% and Karnataka with 7.2%. The Western Zone accounted for 4.29 lakh passenger vehicles, or roughly 31.5% of the national total.
Maharashtra also led commercial vehicles at about 0.46 lakh units, representing 15% of the 3.09 lakh national market. Tamil Nadu accounted for 9.2%, Gujarat 9%, and Uttar Pradesh and Karnataka 7.7% each. The Western Zone recorded about 1.13 lakh commercial vehicles. This is relevant to freight and delivery operators, but state sales alone do not reveal vehicle utilisation, freight rates, route profitability or financing costs.
Uttar Pradesh led two- and three-wheelers
Uttar Pradesh was the largest two-wheeler market with 7.89 lakh units and a 12.3% share. Maharashtra was next at about 7.14 lakh units and 11.1%, followed by Tamil Nadu at 8.8%, Gujarat at 7.7% and Karnataka at 6.5%. The Western Zone led the regional table with 21.13 lakh two-wheelers.
In three-wheelers, Uttar Pradesh accounted for about 0.34 lakh units and 12.1% of the national total. Gujarat followed at 10.3%, Karnataka at 8.8%, Bihar at 8.3% and Tamil Nadu at 6.4%. The Southern Zone had the highest regional three-wheeler volume at about 0.96 lakh units. That pattern is useful context for shared mobility and last-mile transport, but it does not by itself establish which powertrain or model is most economical for an individual operator.
What the state split means for buyers and operators
For passenger-vehicle buyers, a state’s sales rank is a demand indicator, not a promise of a lower on-road price or a wider choice of every model. Registration charges, insurance, financing terms, fuel type, service access and dealer stock can still vary. A buyer comparing petrol, diesel, CNG or EV ownership can use the fuel-cost calculator to test a typical monthly or trip distance against the current assumptions.
For two-wheeler riders, Uttar Pradesh’s 7.89 lakh-unit result shows the scale of the market, while the gap with Maharashtra shows that state leadership can be close in absolute volume. It is still important to separate national sales share from a rider’s actual cost. Current pump rates and the vehicle’s real-world efficiency determine the running-cost result, so the live fuel-price pages are the relevant follow-up when comparing daily commuting or delivery work.
For commercial-vehicle and three-wheeler operators, the numbers point to where demand was strongest during the quarter, but a purchase or route decision needs more than a sales ranking. Payload, operating hours, tolls, maintenance, downtime, fuel or charging access and the rate paid for each trip all affect viability. The road-trip planner can help frame route distance and stop requirements before those costs are compared with a fleet’s own records.
The figures also leave room for cleaner-vehicle demand to grow across more than one category. SIAM said alternative-fuel technologies and electric vehicles were gaining acceptance, but the state-wise sales release does not provide a complete powertrain split. Buyers assessing an EV therefore need to check route charging availability separately rather than infer it from a state’s overall vehicle volume.
What to watch in the next quarter
The next test will be whether these state rankings hold in Q3, covering October–December 2026 and the post-festive period. SIAM attributed Q2’s strong performance to improved affordability after GST 2.0, resilient rural and urban demand, financing support, freight movement and infrastructure activity. It also warned that inflation and any increase in interest rates could moderate demand. That makes the next state-wise release more useful than a single national headline: it can show whether the growth is broad-based or concentrated in a few markets.
Reader takeaway
Maharashtra’s lead in passenger and commercial vehicles, alongside Uttar Pradesh’s lead in two- and three-wheelers, shows that India does not have one uniform vehicle market. The most useful takeaway for a buyer, rider or fleet operator is to pair the national sales picture with the costs of the actual route, fuel or charging plan and vehicle use case. The sales ranking explains where demand was concentrated in Q2 FY27; it does not replace a trip-cost or ownership calculation.
Sources
- Society of Indian Automobile Manufacturers — “Auto Industry Sales Performance of Q2:FY2027 (July–September 2026)” — 15 Oct 2026
- Autocar Professional — “Maharashtra Leads Passenger and Commercial Vehicle Sales in Q2 FY2027: SIAM” — 18 Nov 2026
- TOI Auto — “Uttar Pradesh Is India’s Biggest Two-Wheeler Market With 7.89 Lakh Units In Q2 FY27, But Maharashtra Is Closing In” — 18 Nov 2026
- Free Press Journal — “84 Lakh Vehicles Sold In Just Three Months, Maharashtra And Uttar Pradesh Lead India’s Auto Sales Race” — 18 Nov 2026