Global Fuel Consumption 2021-2026: Annual Data, Regional Shifts, Energy Mix and What the Numbers Really Mean
11 Apr, 2026
A detailed professional guide to global fuel consumption from 2021 to 2026, built around annual oil and liquid-fuels demand, the wider energy mix, regionawl shifts, top consuming countries, policy changes, EV adoption, geopolitics and the outlook for India and the world.
Global Fuel Consumption 2021-2026: Annual Data, Regional Shifts, Energy Mix and What the Numbers Really Mean
Global fuel consumption is one of those topics that almost everyone talks about, but very few pages explain properly. Some articles throw out a single oil-demand number. Some talk only about petrol and diesel. Some mix total energy, crude oil, refined products, biofuels and electricity as if they were all the same thing. They are not. If you want to understand what the world is actually consuming, how quickly that consumption has changed since 2021, and why 2025 and 2026 matter so much, you need a cleaner framework.
This article uses that cleaner framework. For the annual series from 2021 to 2024, it relies on the Energy Institute’s Statistical Review of World Energy for observed world oil consumption. For 2025 and 2026, it uses the U.S. Energy Information Administration’s latest Short-Term Energy Outlook, which provides the most current global liquid-fuels consumption forecast available in early 2026. That means the first four years are observed data, while the last two years are forecasts. This distinction matters, and it is one of the first things serious energy writing should make clear instead of hiding in the fine print.
Sponsored
It is also important to define what “fuel consumption” means in a practical way. In everyday conversation, people often use the word fuel to mean petrol, diesel, LPG, aviation turbine fuel, natural gas, coal, electricity in transport, and sometimes even biofuels. In this article, the core annual comparison is built around global oil and liquid-fuels consumption, because that is the most widely cited and internationally comparable annual fuel-demand series. But the analysis does not stop there. The article also explains how gas, coal, renewable power, EVs, efficiency gains and geopolitics affect the broader fuel story, because no honest 2026 discussion can treat oil in isolation.
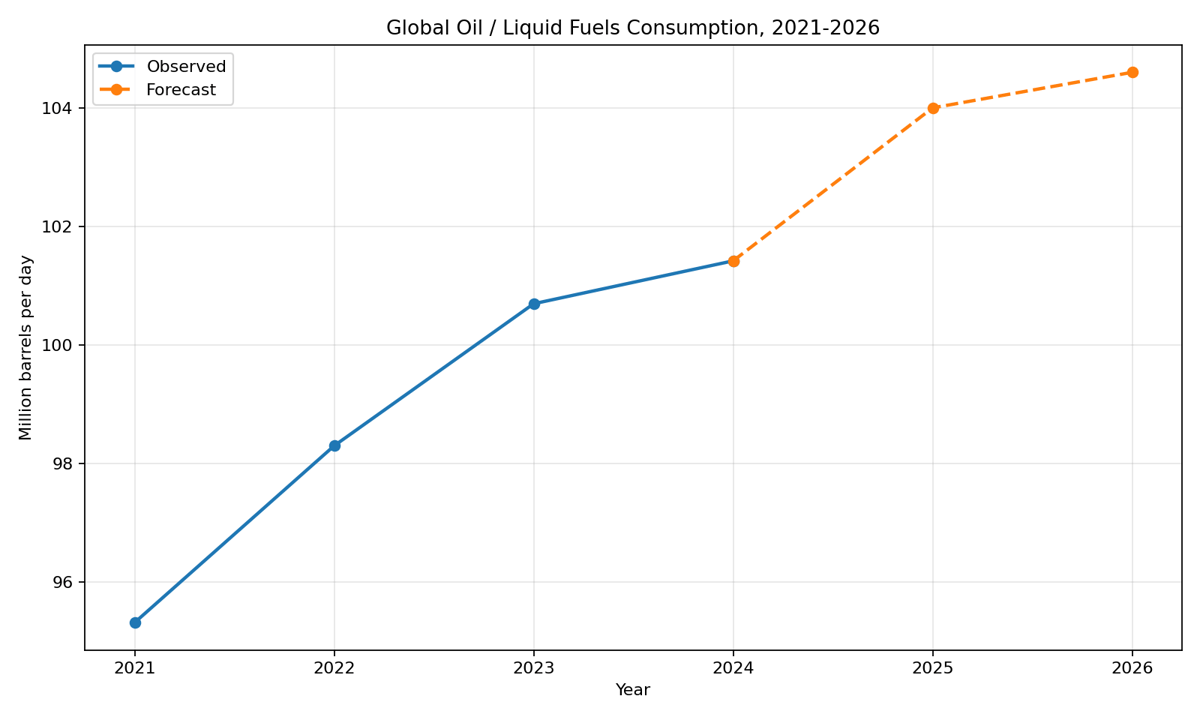
Observed world oil consumption from 2021 to 2024 and forecast global liquid-fuels consumption for 2025 and 2026.
The headline numbers first
If you want the short version before the long explanation, here it is. World oil consumption recovered strongly after the pandemic years and continued rising through 2024. On the observed historical series, the world consumed about 95.3 million barrels per day in 2021, 98.3 million barrels per day in 2022, 100.7 million barrels per day in 2023 and 101.4 million barrels per day in 2024. For the near-term outlook, the EIA’s April 2026 Short-Term Energy Outlook puts global liquid-fuels consumption at 104.0 million barrels per day in 2025 and 104.6 million barrels per day in 2026. In plain English, the world is still using more fuel, not less, even as the growth rate is becoming more contested and more policy-sensitive.
Year
Global oil / liquid-fuels consumption
Status
What it tells us
2021
95.314 mb/d
Observed
Reopening year after the deepest Covid shock
2022
98.297 mb/d
Observed
Demand kept recovering despite war and inflation
2023
100.694 mb/d
Observed
The world moved decisively above the 100 mb/d line
2024
101.418 mb/d
Observed
Record use continued despite energy-transition momentum
2025
104.0 mb/d
Forecast
Near-term demand remains resilient
2026
104.6 mb/d
Forecast
Growth slows, but global use still rises
These numbers tell two stories at once. The first is straightforward: the world still consumes vast amounts of oil and liquid fuels, and the total has continued to climb over the period covered here. The second story is more subtle: the shape of growth is changing. The post-pandemic rebound phase was about returning mobility, returning trade and returning industrial demand. The 2025 and 2026 phase is more complicated. Growth is still there, but it is increasingly influenced by efficiency, EV adoption, petrochemicals, fuel-saving policies, supply disruptions and regional imbalances.
Why 2021 matters more than people remember
Many summaries of fuel demand jump straight from “the world recovered after Covid” to “demand hit records again.” That skips the most important analytical point. In 2021, fuel consumption did not simply bounce back because people wanted to drive again. It recovered because the global economy was switching back on unevenly and because transport, manufacturing, logistics and household movement all restarted at different speeds. Aviation remained weak for much of the period, while road mobility returned earlier. Freight stayed strong because global goods demand was still elevated. Industry absorbed energy as factories restarted. The result was a broad but imperfect demand recovery.
This is why the 2021 number matters. At about 95.3 million barrels per day on the historical world oil-consumption series, 2021 established a new post-shock baseline. It was the year that proved the pandemic had damaged demand, but had not permanently broken the world’s dependence on liquid fuels. When energy writers ignore this point, they miss the strategic lesson. Temporary demand destruction is not the same thing as structural demand decline.
There is another reason 2021 matters: it reset expectations. Policymakers, refiners, producers and transport operators all saw that demand could come back faster than public narratives suggested. Once that happened, the whole market conversation changed. Companies went back to thinking not just about decarbonisation, but also about resilience, spare capacity, storage, and the cost of being underprepared for renewed fuel demand.
2022: the year demand kept rising even when the world was under stress
The second major lesson in the series comes from 2022. If 2021 was the reopening year, 2022 was the year that tested whether fuel demand could keep growing under pressure. It did. The historical world series rose to about 98.3 million barrels per day, even though the year was marked by war, sanctions, inflation, shipping disruption and intense price volatility.
This should not be misunderstood as proof that fuel demand is insensitive to price. It is not. What 2022 showed instead is that short-run demand in a still-growing world economy can remain surprisingly sticky when large parts of the system have no easy substitute. Trucking fleets do not electrify overnight. Aviation does not stop needing jet fuel because crude is expensive. Petrochemical chains do not suddenly redesign their feedstock mix in a quarter. Public transport systems do not instantly absorb all private mobility. In energy economics, this is where practical demand elasticity becomes more useful than ideological debate.
For a professional long-form article, 2022 is the year that forces a serious distinction between high prices and low demand. Sometimes high prices reduce demand directly. Sometimes they simply make the same demand more painful, more inflationary and more politically visible. That second effect is extremely important because it explains why economies can feel severe fuel stress without showing dramatic immediate reductions in aggregate consumption.
2023: the world crossed back above the 100 mb/d line
By 2023, the big symbolic threshold had returned: global consumption moved decisively back above 100 million barrels per day. The observed series in the Energy Institute review puts the world at about 100.7 million barrels per day. This matters not because 100 is a magical number, but because crossing it again signalled that the post-pandemic repair was no longer just a rebound. It had become a renewed high-level demand environment.
In professional energy writing, this is where the article should widen the frame. The 2023 story was not simply “more driving.” It was about the interaction of three different demand engines. The first was mobility: roads, freight, aviation and shipping all contributed. The second was petrochemicals, which the IEA has repeatedly identified as a critical source of medium-term oil-demand growth. The third was emerging-market development, especially in non-OECD Asia, where rising incomes, industrial activity and mobility needs still support fuel use even as advanced economies become more efficient.
This is also where the transition story becomes more complicated than either side often admits. Clean-energy deployment accelerated. EVs kept growing. Renewable power kept scaling. But the world still used more fuel in total. That does not mean the transition is fake. It means the transition is occurring in a world where total energy demand is still rising and where old and new systems coexist rather than swapping places cleanly in one step.
2024: record highs in a world that still talks about transition
The 2024 data underline that contradiction even more clearly. The observed world oil-consumption series rises to about 101.4 million barrels per day. At the same time, the Energy Institute’s 2025 Statistical Review says world total energy demand reached a record 592 exajoules in 2024, with oil at 199 EJ, natural gas at 149 EJ and coal at 165 EJ. The same review says fossil fuels still accounted for about 87% of the global energy mix in 2024.
That is one of the most important context points in the whole article. When people ask, “Is the world using less fuel?” the best professional answer is: not yet, not in total, and not in a way that can be summarised honestly by one clean headline. The world is deploying more low-carbon energy at the same time as it is consuming more total energy. That is why 2024 is such a revealing year. It captures the world in transition, but not yet in decline on the fuel side.
It also explains why simplistic narratives fail. If you only look at EV sales, you might conclude oil is doomed immediately. If you only look at record fuel demand, you might conclude the transition is meaningless. Both conclusions miss the actual structure of the market. The market is in an additive phase: renewables are growing fast, electricity demand is rising, and fossil fuels are still large enough that they also set records when the global economy expands.
2025: why the forecast matters almost as much as the history
The EIA’s April 2026 Short-Term Energy Outlook puts global liquid-fuels consumption at 104.0 million barrels per day in 2025. Because 2025 is still being finalised in real time when this article is written, the correct way to use that number is not as settled history but as the most current benchmark available from a major official forecasting institution.
What makes the 2025 number important is not just the level itself. It is what the level says about resilience. Even with policy pressure, EV growth and slower macro conditions in parts of the world, demand did not vanish. The world still needed large volumes of liquid fuels to keep freight moving, aircraft flying, ships sailing, petrochemical plants supplied and households connected to mobility systems that remain oil-linked more often than public debate suggests.
That said, 2025 is also a year when the composition of demand matters more than the total. Analysts increasingly focus on where growth is coming from and what kind of oil demand is growing. The IEA’s medium-term analysis has already argued that petrochemical feedstocks and non-OECD Asia play an outsized role in keeping demand supported, while transport-fuel growth increasingly faces technological and behavioural constraints. In professional terms, this is the difference between “the market still grows” and “the market still grows for the same reasons.” It does not.
2026: higher total demand, slower growth, more uncertainty
The EIA now projects global liquid-fuels consumption at 104.6 million barrels per day in 2026. That is only 0.6 million barrels per day above the 2025 figure in the April 2026 outlook, and the EIA explicitly says it cut its 2026 demand-growth assumption from 1.2 million barrels per day in the previous month to 0.6 million because of fuel shortages, government efforts to reduce fuel use, and the curtailment of refined-product exports as disruptions spread through the market.
This is exactly the kind of nuance strong content should capture. 2026 is not a year of collapsing demand. It is a year of demand under pressure. The total still rises, but the slope becomes flatter. When readers see only the top-line number, they miss the point. The most interesting analytical move is not to stop at “104.6.” It is to ask why the growth rate has been revised lower and what that says about market fragility.
The answer is that the market now reflects overlapping forces: persistent underlying demand, supply-chain bottlenecks, geopolitical risk, efficiency measures, and the increasing policy willingness to push down fuel use when disruptions become severe. That combination makes 2026 a pivotal year in the narrative. Consumption is still high, but the system is becoming more sensitive to policy and disruption.
What fuel consumption really means in 2026
Before going further, it is worth slowing down and defining the term at the centre of the article. In public conversation, “fuel consumption” often means one of five different things: total oil demand, total liquid-fuels demand, retail transport-fuel demand, total energy demand, or broad fossil-fuel use. These are related but not interchangeable.
For comparability across 2021-2026, this article’s annual series is anchored in oil and liquid fuels. That makes sense because oil remains the most globally traded transport-linked fuel and because annual demand is usually discussed in barrels per day. But no serious long-form explanation should stop there. The broader energy system matters too. The world’s 2024 total energy supply of 592 EJ included large contributions from oil, coal and natural gas, alongside fast-growing renewables and nuclear. If you only focus on oil, you understand mobility and petrochemicals but miss power systems and industry. If you only focus on total energy, you lose the clarity of the global liquid-fuels trend that still drives inflation, shipping, geopolitics and transport economics. Good writing needs both views.
That is why the best way to read the numbers is layered. First, look at the oil/liquid-fuels annual path. Then ask how the broader fuel mix and energy transition affect that path. Only after that should you move to country-specific implications.
The 2024 energy mix: why oil is still central even when the story is broader
The 2024 global energy mix explains why fuel consumption remains such a powerful subject. Oil contributed around 199 EJ in the Energy Institute review, more than natural gas and more than any other single fuel category shown in the regional overview chart. Coal was also extremely large at 165 EJ, while natural gas reached 149 EJ. In other words, the world was not transitioning from fossil fuels from a low base. It was transitioning from a very high fossil-fuel base in which all the major hydrocarbons still mattered simultaneously.
Oil is especially important because it connects so many sectors at once. It powers road transport directly through petrol and diesel. It supports aviation through jet fuel. It underpins shipping through marine fuels. It feeds petrochemicals and plastics. It affects logistics, farm operations, mining, industrial processing and consumer prices. This is why oil demand remains such a central macroeconomic variable even as electricity and clean technology grow. A barrel of oil carries not only energy, but also system-wide price influence.
This is also why professional content has to resist the temptation to write the fuel story as if it were only a climate story or only a commodities story. It is both, and more. Fuel consumption is a transport story, an industrial story, a geopolitical story, an inflation story and a development story at the same time.
Regional shifts: where fuel demand is strongest now
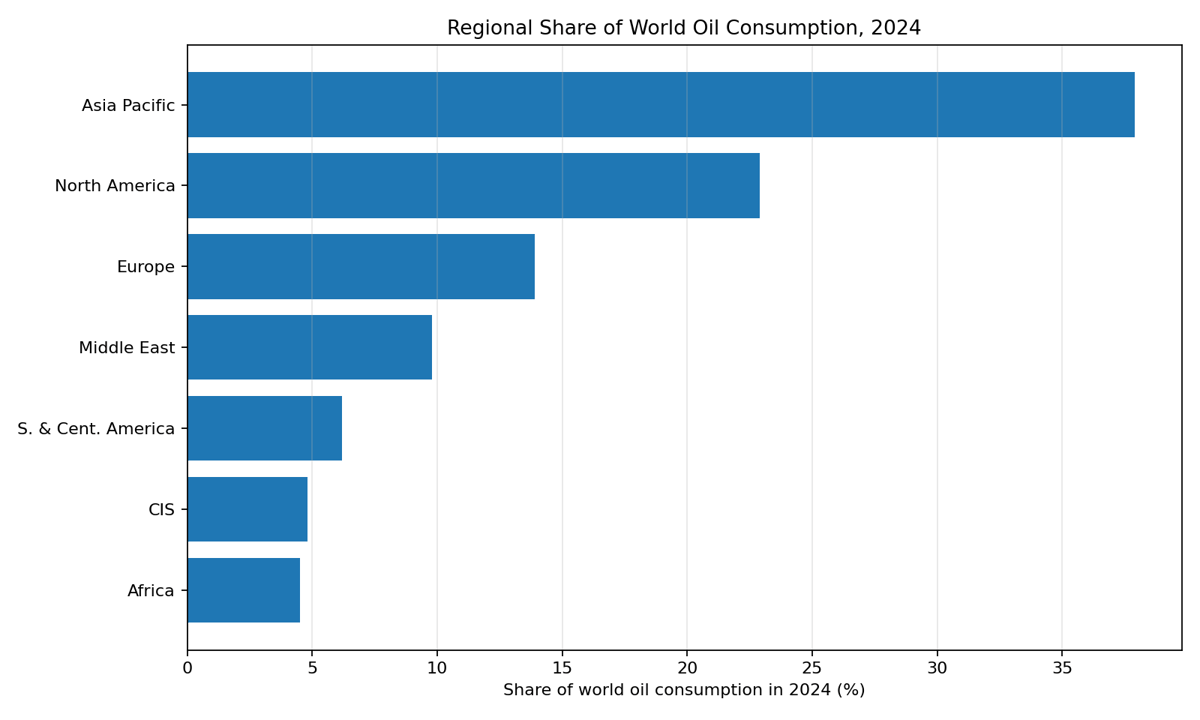
Asia Pacific remains the largest consuming region, while North America continues to dominate per-capita-heavy oil use.
One of the clearest lessons from the 2024 regional data is that fuel demand is no longer centred in one narrow block of rich economies. The largest regional consumer was Asia Pacific, which accounted for about 37.9% of world oil consumption in 2024. North America followed at 22.9%, then Europe at 13.9%, the Middle East at 9.8%, South and Central America at 6.2%, the CIS at 4.8%, and Africa at 4.5%.
That regional structure matters because it tells you something crucial about future growth. When Asia Pacific is already the largest consumer and still contains a wide range of economies at different stages of development, the region has enormous influence over global demand direction. China and India are central to that story, but they are not the whole story. Southeast Asia, industrial supply chains, shipping routes and petrochemical expansion all play a role too.
North America’s share, meanwhile, remains very large, which reminds us that advanced economies have not exited the fuel story. Their efficiency has improved, and transition policies are stronger, but their systems still consume large volumes. Europe is lower than North America in absolute share, yet still substantial. The Middle East’s role is also interesting because it is both a major producer region and a large consuming region in its own right.
The top consuming countries: why scale still matters
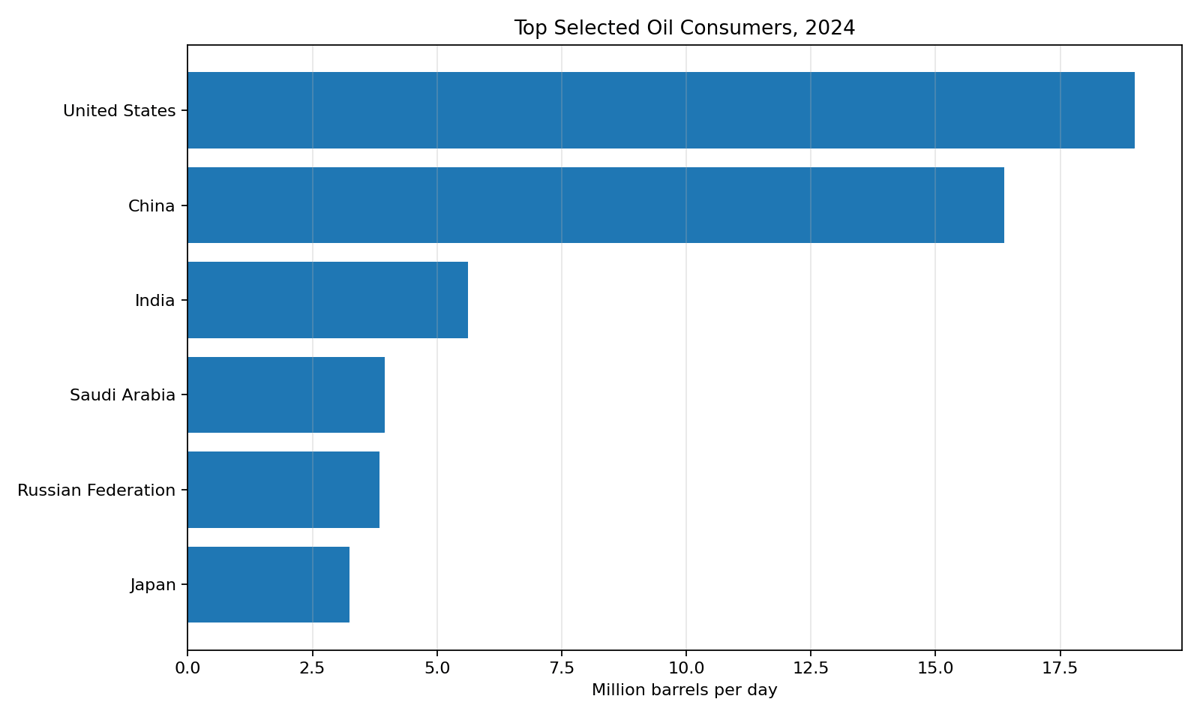
The United States, China and India remain the most important countries to watch in any fuel-demand discussion.
At the country level, a few names still dominate any global consumption story. In 2024, the United States consumed about 18.995 million barrels per day, China about 16.374 million barrels per day, and India about 5.621 million barrels per day on the Energy Institute’s oil-consumption table. Saudi Arabia, Russia and Japan also remained large consumers at much lower levels.
What this ranking shows is that size and growth need to be analysed together. The United States is still the largest single consumer in the series cited here, but China and India matter disproportionately for growth narratives because they shape the future more than mature demand systems do. India is especially important because it combines high development needs, rising vehicle ownership, industrial expansion and a large import requirement. That means even moderate changes in India’s fuel intensity can have large market consequences.
China’s role is more complex. It remains a giant consumer, but the quality of its growth matters just as much as the quantity. Industrial demand, petrochemicals, freight and the pace of electrification all influence the country’s oil profile. Japan, by contrast, remains a large user but in a more mature, slower-growth context. Saudi Arabia and Russia remind us that producer countries are not only exporters; they are also major domestic consumers.
Why the world is still using more fuel
This is the core explanatory question, and it deserves a direct answer. The world is still using more fuel because several large structural drivers are still expanding at once.
First, total energy demand is still growing. The Energy Institute says total energy demand rose 2% in 2024 to 592 EJ. If the size of the global energy system keeps growing, fossil fuels can still rise in absolute terms even when cleaner technologies grow faster in percentage terms.
Second, the transport system remains deeply dependent on oil. Passenger cars get the most public attention, but global transport also includes trucks, buses, construction equipment, farm equipment, shipping and aviation. Many of those segments are much harder to decarbonise quickly than headlines imply.
Third, petrochemicals keep supporting oil demand. The IEA’s medium-term oil outlook has stressed that petrochemical feedstocks are a crucial reason oil demand does not simply fall in line with rising EV sales. Plastics, solvents, chemicals, packaging and industrial intermediates all tie parts of oil demand to industrial systems rather than only transport systems.
Fourth, many emerging economies are still in an energy-addition phase. They are not replacing one unit of oil with one unit of renewable power. They are often adding renewables and still increasing total energy use at the same time because mobility, construction, logistics and household access are all expanding.
Why growth is slowing even though totals remain high
Just as important as the previous section is this one: why is the growth rate flattening even though the total remains enormous? The answer lies in a different set of structural forces.
The IEA’s Oil 2024 report says increasing EV use, clean-energy technologies and broader efficiency policies are combining to push the world onto a much slower oil-demand growth trajectory toward the end of the decade. This does not mean oil demand collapses immediately. It means the conditions for perpetual fast growth are weakening.
Efficiency is part of the story. Engines have improved. Logistics networks are more optimised. Some firms are more disciplined about fuel use when costs spike. Urban transport systems in some regions have shifted incrementally away from private liquid-fuel use.
Electrification is another part. The IEA’s Global EV Outlook 2025 explicitly frames the EV market not only around vehicle sales, but around oil displacement. Even without needing a single headline displacement number, the direction is clear: each year of sustained EV growth adds to the pressure on future road-fuel demand.
Policy also matters more now. The EIA’s April 2026 outlook cut its 2026 demand growth assumption in part because governments were responding to shortages and high prices with efforts to reduce fuel use. That is an important signal. Policymakers are becoming more willing to intervene on the demand side when the cost of inaction becomes visible.
Transport, aviation, shipping and petrochemicals: the four demand engines to watch
The most useful way to understand fuel consumption in professional writing is to split demand into engines rather than treat it as one giant black box.
Road transport remains the biggest and most visible engine. Petrol and diesel demand in road systems are still central to the global fuel story, especially outside highly electrified urban markets.
Aviation is critical because it recovered after the pandemic and still has limited near-term substitutes at scale. When passenger and freight aviation strengthen, fuel demand can surprise to the upside.
Shipping matters because world trade does not run on rhetoric. It runs on bunkers, routes, ports and freight economics. Shipping fuel demand is influenced by trade levels, rerouting, speed management and environmental rules, but it does not disappear simply because decarbonisation targets exist.
Petrochemicals are the least understood by general readers and perhaps the most important for the medium-term story. Petrochemical demand helps explain why oil can remain strong even when passenger-vehicle electrification accelerates. A world that consumes more plastics, packaging, synthetic materials, chemicals and industrial feedstocks can keep supporting oil demand even if one part of the transport system becomes cleaner.
Fuel prices do not move consumption in a straight line
Another common mistake in fuel coverage is to assume that higher prices mechanically equal lower consumption. In reality, the relationship is more staggered. Very high prices can reduce consumption, but the timing and depth depend on income, substitution options, policy support, industrial structure and whether the price shock is brief or sustained.
This is why professional energy analysis distinguishes between pain and destruction. High prices can hurt households, strain businesses, raise inflation and provoke policy response long before they produce a dramatic drop in total global demand. In poor and import-dependent economies, the pain can be severe even when the measured consumption number has not fallen enough to satisfy a simplistic “high price, low demand” assumption.
This point matters for 2026 especially. The EIA now expects weaker demand growth partly because shortages, government actions and export curtailments are affecting use. But the total still rises to 104.6 mb/d in the forecast. That is exactly what a sticky but pressured system looks like.
The role of EVs and why they matter without eliminating fuel demand overnight
The strongest transition force operating on transport fuel today is electric mobility. The IEA’s Global EV Outlook 2025 treats EV sales, charging infrastructure and oil displacement as linked parts of the same market story. That framing is useful because it reminds readers that EVs matter not only as a technology trend, but as a demand-side force on oil.
Still, the right interpretation is not “EVs will immediately crush fuel demand everywhere.” The right interpretation is more precise: EVs increasingly constrain road-fuel growth, especially in passenger vehicles, and over time that changes the composition of oil demand. But aviation, shipping, freight, petrochemicals and the uneven pace of electrification mean total liquid-fuels demand can remain high for years even while EVs reshape one major slice of the system.
For content quality, this is a crucial distinction. Overstating EV impact weakens credibility. Understating it does the same. The professional position is to say that EV growth is one of the clearest reasons long-run oil-demand growth is slowing, even as short-run and medium-run totals remain large.
India in the global fuel map
No serious blog on global fuel consumption in 2026 should ignore India. The country matters in at least three different ways. It is one of the world’s largest fuel consumers. It is one of the most important growth markets in the medium term. And it remains highly dependent on imports for crude oil.
On the Energy Institute’s 2024 table, India consumed about 5.62 million barrels per day, placing it firmly among the most important oil-consuming countries in the world. Meanwhile, India’s own official energy statistics say the country’s crude-oil import dependency was around 89.44% in FY2024-25. That combination — high consumption plus high import dependence — is what makes India such an important case study in how global fuel trends translate into national economic risk.
For India, global fuel consumption is never only a global story. It becomes a domestic inflation story, a fiscal story, a rupee story, a logistics story and a consumer story. When world oil demand rises, supply tightens or shipping is disrupted, India feels the effect not only through crude prices but through fuel marketing, freight costs, imported inflation and policy trade-offs. That is why Indian readers should not treat world consumption numbers as abstract. They directly shape domestic vulnerability.
India also matters because its future path will influence global demand. Rising incomes, urbanisation, freight needs and industrial growth can all sustain fuel use. At the same time, India is investing in renewables, EVs, biofuels and efficiency. So it embodies the same tension seen globally: growth and transition moving together rather than one replacing the other immediately.
What the 2021-2026 series says about the transition debate
If you step back from the year-by-year noise, the six-year sequence tells a bigger story. First, the world recovered from the pandemic demand shock faster than many expected. Second, high prices and geopolitical stress did not prevent fuel use from rising back above 100 mb/d. Third, 2024 confirmed that record fuel use can coexist with record clean-energy expansion. Fourth, 2025 and 2026 suggest that total use can keep rising even as the rate of growth slows under policy, efficiency and supply-pressure effects.
That is a much more useful conclusion than “fuel demand is exploding forever” or “fuel demand is finished.” Both are too blunt. The reality is more interesting: the world is still consuming more fuel in absolute terms, but the structure of that growth is becoming less transport-only, less automatic and more contested by technology, policy and geopolitics.
What could change the outlook quickly?
Even the best forecasts are conditional. Three kinds of shocks could change the 2025-2026 picture quickly.
The first is geopolitical disruption. When a major chokepoint or producer region is disrupted, prices rise, shipping reroutes, stock draws change and governments respond. The EIA’s April 2026 outlook is itself shaped by exactly this kind of event.
The second is macro slowdown. If global growth weakens more sharply than expected, transport, freight and industrial demand can lose momentum. That is the classic demand downside risk.
The third is faster-than-expected efficiency and electrification. If EV adoption, charging networks, power-system reliability and policy incentives all improve faster than current assumptions, road-fuel demand could flatten sooner than the consensus expects.
But there are upside risks too. Emerging-market mobility, aviation recovery, shipping rerouting, petrochemical expansion and weather-driven energy demand can all keep the system tighter than optimistic transition narratives assume.
Comparison points that matter most
If you only remember a few comparison points from this article, make them these.
2021 to 2024 was mainly a recovery-and-expansion phase; 2025 to 2026 is more of a resilience-and-friction phase.
Total demand is still rising, but the pace of growth is more vulnerable to policy and disruption.
Asia Pacific is the largest consuming region, but North America remains huge and highly relevant.
The world energy system is adding clean energy, yet fossil fuels still dominate the total mix.
Oil demand is increasingly shaped by petrochemicals and emerging-market growth, not only passenger vehicles.
India is central to the discussion because it combines large fuel demand with very high crude-import dependence.
A practical reading of the charts
The first chart in this article shows a rising line from 2021 to 2026, but the shape of that rise matters. The observed jump from 2021 to 2022 and the move above 100 mb/d by 2023 tell the story of demand recovery and persistence. The smaller step from 2025 to 2026 in the forecast reflects a market that is still growing, but no longer growing as comfortably as before.
The regional chart matters because it reminds us that fuel consumption is not one-country economics. Asia Pacific’s share is large enough that the global story increasingly depends on how the region develops, consumes and substitutes. But the remaining regions together are still too important to ignore. This is not a one-region market.
The top-consumer chart matters because it makes one simple point vivid: the United States, China and India shape the world fuel conversation more than almost anyone else. When these three move, the global discussion changes.
Frequently asked questions
Is global fuel consumption falling?
Not in the 2021-2026 series used here. The observed oil-consumption data rise from about 95.3 mb/d in 2021 to 101.4 mb/d in 2024, and the latest EIA forecast takes global liquid-fuels consumption to 104.6 mb/d in 2026.
Why is the world still using so much fuel if renewables and EVs are growing?
Because total energy demand is still rising, transport remains deeply oil-linked in many segments, petrochemical demand remains strong, and much of the transition is additive rather than purely substitutive at this stage.
What is the biggest consuming region?
Asia Pacific, with about 37.9% of world oil consumption in 2024 on the Energy Institute table used here.
Which countries matter most?
The United States, China and India are the most important countries to track in any global fuel-demand discussion, because of their size, growth profile and market influence.
Are 2025 and 2026 actual numbers?
No. In this article, 2025 and 2026 are forecast values from the EIA’s April 2026 Short-Term Energy Outlook, not final observed full-year totals.
Why does India matter so much in a global fuel article?
Because India is one of the world’s largest oil-consuming countries and remains highly dependent on crude imports. That makes it both a major source of demand and a highly exposed consumer of global energy shocks.
Final conclusion
The clearest way to summarise global fuel consumption from 2021 to 2026 is this: the world has not exited the age of fuel dependence, but it has entered a more complex phase of that dependence. Consumption recovered sharply after the pandemic, crossed back above 100 million barrels per day, and continued to set new highs even as transition technologies accelerated. Yet the quality of growth is changing. Demand is still rising, but it is increasingly shaped by efficiency, electrification, petrochemicals, policy response and geopolitical disruption.
That makes 2026 an especially important year to watch. The total is still huge. The trend is still upward. But the system is becoming more conditional and more politically sensitive. That is exactly why serious readers, businesses, policymakers and even ordinary consumers should care about these numbers.
If you understand the six-year path correctly, you understand something bigger than a commodity chart. You understand how the world is moving, how it is producing, how it is consuming, and where the next big pressures are likely to come from.
Data note: 2021-2024 oil-consumption figures are based on the Energy Institute Statistical Review of World Energy 2025. The 2025-2026 liquid-fuels figures are based on the U.S. EIA Short-Term Energy Outlook released in April 2026. Additional context on structural oil-demand trends comes from the IEA’s Oil 2024 and Global EV Outlook 2025, while India-specific dependence context comes from Energy Statistics India 2026.
A deeper annual narrative: 2021 in detail
The easiest mistake to make about 2021 is to call it a “bounce-back year” and move on. That is too lazy for a serious reader. A better description is that 2021 was the year the global fuel system rediscovered its depth. Demand did not return because one thing came back. It returned because thousands of connected activities resumed at the same time: commuting, tourism, domestic logistics, factory operation, port handling, consumer delivery, road construction, agricultural movement and industrial production. When those layers overlap, liquid-fuels demand does not recover in one neat block; it rebuilds through the network.
Think about what the world economy looked like then. Many countries were reopening at different speeds. Air travel was still uneven. Consumer mobility was stronger in some cities than in others. Industrial demand was restarting faster in some regions than in others. Yet the aggregate number still rose sharply because the fuel system serves many sectors simultaneously. That is the key lesson. Fuel demand is diversified demand. You can weaken one channel and still watch the total recover because other channels compensate.
This is also the year that reminded analysts how difficult it is to permanently destroy fuel demand without changing the underlying systems that create it. A temporary public-health shock reduced consumption. But once mobility, trade and production restarted, demand came back because most of the assets in the system — engines, aircraft, refineries, trucks, ports, supply contracts and industrial designs — were still built around fossil fuels. A professional article has to say this clearly, because otherwise readers may confuse temporary suppression with structural change.
In retrospect, 2021 also prepared the market psychologically for tighter conditions later. Producers, traders, refiners and governments realised that demand could return faster than they expected. That matters because the downstream consequences of that realisation show up in later years: investment debates, stockholding discussions, strategic-reserve thinking, and more sensitivity to any future supply shock.
A deeper annual narrative: 2022 in detail
The 2022 story deserves to be read slowly because it revealed one of the hardest truths about energy systems: the world can be under real fuel stress and still consume more fuel overall. The war-related dislocations, sanction effects, freight rerouting and inflation fears were all significant. Yet total consumption still increased. The correct interpretation is not that prices do not matter. It is that systems matter more when substitution options are limited.
Households can postpone some travel, firms can trim some logistics costs, and some consumers can shift toward public transport when prices rise. But many of the largest fuel-consuming activities do not respond instantly. Freight contracts still need to be executed. Farm production still needs diesel. Ships still cross oceans. Airlines cannot redesign fleets in one season. Construction equipment still runs. Petrochemical plants still need feedstocks. So even when the public feels a severe shock, the aggregate demand response can remain smaller than intuition suggests.
This is why 2022 remains such a useful teaching year. It helps explain why policymakers worry about oil even when they support the transition. Oil matters not only because it is large, but because parts of the system remain locked in. When shocks hit a locked-in system, the first response is often inflation and redistribution of pain, not immediate and proportionate destruction of volume.
For readers trying to connect fuel demand with daily life, 2022 is also the year that shows how macro data and consumer sentiment can diverge. People can feel fuel stress intensely even while the world aggregate number rises. That is not a contradiction. It is what happens when prices transmit pain faster than behaviour can transmit adjustment.
A deeper annual narrative: 2023 in detail
The return above 100 million barrels per day in 2023 should be understood as both a symbolic and structural moment. Symbolically, it ended the idea that the post-pandemic world might naturally settle into a permanently lower oil-use regime. Structurally, it showed that demand was no longer being supported only by reopening effects. The system was now running on broader foundations again.
In 2023, the debate around fuel demand shifted from “Will it recover?” to “What will now shape the next phase of growth?” That is a more sophisticated question, and the answer points to the same themes that still matter in 2026: non-OECD Asia, petrochemical feedstocks, aviation recovery, freight and the uneven pace of electrification.
This is also the point in the timeline where the transition debate becomes analytically harder. EVs were already scaling. Power systems were adding more renewable capacity. Governments were pushing efficiency harder. And yet global oil demand was still rising. A weak article would turn that into a shouting match between “transition supporters” and “fossil defenders.” A strong article does the opposite. It explains that the energy transition is occurring within a still-growing demand system. The problem is not that the transition is fake. The problem is that the base being transformed is very large and still expanding in many parts of the world.
That is why 2023 matters intellectually. It forced analysts to stop writing energy stories as if only one force could dominate at a time. Growth and transition were happening together. Oil demand and EV adoption were both real. That duality is now central to serious energy writing.
A deeper annual narrative: 2024 in detail
The 2024 data added another layer to that duality. Not only did oil demand remain high, but total energy demand itself also set a record. The Energy Institute’s headline figure of 592 EJ tells you that the world did not simply reshuffle fuels within a flat system; it consumed more energy in total. That matters because it changes the political and economic meaning of fuel demand.
In a flat demand world, clean energy could displace fossil fuels more visibly year after year. In a rising demand world, clean energy can grow very rapidly and still coexist with high or even rising fossil-fuel use. This is exactly what makes 2024 so revealing. Wind and solar can grow quickly. EVs can expand. Electricity demand can surge. And yet oil, gas and coal can all remain large because total demand is also expanding.
That is not an argument against the transition. It is an argument for realism. It says that fuel-demand analysis should be grounded in systems thinking rather than hope or fear. If an energy writer ignores total demand growth, the analysis becomes shallow. If the writer ignores clean-energy acceleration, the analysis becomes equally shallow. The challenge is to hold both truths together.
From a market point of view, 2024 was also important because it confirmed that investors, refiners and policymakers could not safely assume an immediate decline in fuel use. That affects planning decisions. Refinery strategy, shipping risk management, petrochemical investment and strategic stock policy all depend on credible beliefs about demand persistence. 2024 told the world that persistence was still real.
A deeper annual narrative: 2025 in detail
Forecast years are often treated as less interesting than historical years, but that is usually because they are written badly. A good forecast discussion is not just a number. It is a statement about what a forecasting institution thinks the system will do under a specific set of assumptions. That is why the EIA’s 104.0 mb/d figure for 2025 is informative. It tells us that the official view of the near-term market still assumes a very large, very active liquid-fuels system.
That matters because forecasts influence decision-making long before reality is fully observed. Refiners, transport planners, producers, investors and policymakers all respond not only to history, but to credible forward expectations. A 2025 number above 104 mb/d is not just a datapoint. It is a statement that, despite transition forces, near-term liquid-fuels demand still looks strong enough to sustain a very large system.
At the same time, the way professional writers should handle 2025 is with discipline. Because it is a forecast, it must be framed as provisional. Good content should never blur the difference between observed and projected data. That is why this article keeps the distinction explicit. Trust improves when the writer names uncertainty instead of hiding it.
There is another reason 2025 matters. It sits between the cleaner historical arc of 2021-2024 and the more visibly disrupted assumptions of 2026. In that sense, 2025 is the bridge year: high demand remains, but the market is moving toward a period in which the quality of growth matters more than before.
A deeper annual narrative: 2026 in detail
The EIA’s April 2026 outlook is unusually revealing because it does more than publish a number. It explains why that number changed. Demand growth is slower in the latest forecast not because the world no longer needs fuel, but because the system is under active strain: fuel-use reduction measures, shortages, export curtailments and wider disruption all weigh on behaviour.
This is an important moment in the intellectual history of fuel-demand writing. Earlier years in the series were mainly about rebound or persistence. The 2026 discussion is about resilience under stress. That is a different kind of market. In a resilience market, the question is not “Is demand strong?” but “How much strain can the system absorb before behaviour, policy and prices begin to reshape the demand path?”
The answer, at least for now, is that the system still absorbs quite a lot. The total is still forecast to rise. But it is rising more slowly, and the reasons for the slowdown reveal the modern constraints on fuel demand: policy intervention, efficiency, alternative technology, and the rising economic cost of disruption.
This is why 2026 should be read not as a collapse story but as a transition-pressure story. High totals remain. Yet the system is now more exposed to shocks and more responsive to deliberate attempts to reduce fuel use. That is a big strategic shift from the assumptions many analysts held only a few years ago.
How professional writers should handle definitions, units and comparability
The best energy writing is careful not just with claims, but with units. World oil demand is usually discussed in barrels per day. Broader energy demand is often discussed in exajoules. Regional shares may be expressed as percentages. Retail prices may be per litre or per gallon. Import dependence may be expressed as a percentage of domestic consumption or of energy use. If a writer mixes these without warning, readers come away confused even if every individual number is technically correct.
That is why serious content should always tell the reader what exactly is being compared. In this article, the annual 2021-2024 series is observed world oil consumption in million barrels per day on the Energy Institute definition. The 2025-2026 values are EIA global liquid-fuels consumption forecasts, also in million barrels per day. The wider system discussion uses the Energy Institute’s total energy supply in exajoules for 2024. Each number has a place; none should be forced to do the work of every other number.
This may sound technical, but it is one of the biggest differences between casual content and professional writing. Professional writers do not just collect facts. They preserve the logic that allows facts to remain meaningful when read together.
What petrochemicals change in the oil-demand discussion
A large share of weak energy writing focuses almost entirely on transport. That misses one of the most important structural reasons oil demand remains resilient: petrochemicals. The IEA’s medium-term work highlights petrochemical-driven demand growth because petrochemicals connect oil to manufacturing and consumer systems that sit outside the narrow “fuel at the pump” frame.
When economies industrialise, urbanise and consume more processed goods, oil-linked materials show up everywhere: plastics, packaging, fertilisers, construction products, fibres, solvents, consumer goods, industrial inputs and medical materials. Even if one segment of transport begins to electrify quickly, petrochemicals can keep parts of oil demand firm.
This is analytically important because it changes the kinds of questions that readers should ask. The relevant question is no longer only “How many more EVs are being sold?” It is also “How much petrochemical demand is the industrial and consumer economy adding?” When those two questions are asked together, the resilience of oil demand becomes easier to understand.
For a long-form blog, this is exactly the kind of point that turns a simple update into a genuinely useful explainer. It helps readers understand why the demand story is more durable than a one-sector narrative would suggest.
Aviation and shipping: the sectors that keep energy analysts humble
Whenever people want to make fast claims about declining fuel use, aviation and shipping usually provide the necessary dose of realism. These sectors are essential because they remain deeply liquid-fuels dependent and operate on long asset cycles. Aircraft fleets turn over slowly. International shipping runs through infrastructure, ports, routes and vessel lifecycles that do not transform overnight.
That does not mean these sectors will never change. It means their pace of change matters. If passenger aviation rebounds after disruptions, jet-fuel demand can rise meaningfully. If shipping routes lengthen because of chokepoint disruptions or geopolitical rerouting, total bunker-fuel consumption can become more complicated than the basic trade-volume number suggests.
This is another reason professional content should treat the fuel system as a network rather than a single variable. It is not enough to say “cars are electrifying.” You also need to ask what is happening in planes, ships, petrochemical plants and freight corridors. That broader view is where many of the strongest insights live.
Efficiency is rising, but demand is rising too: how both can be true
One reason fuel statistics confuse non-specialists is that efficiency improvements and rising total consumption can happen at the same time. A truck can become more efficient, while the freight system carries more total goods. An economy can use less fuel per unit of output, while total output rises enough to push total fuel use upward. A city can sell more EVs, while national aviation demand and industrial activity keep aggregate liquid-fuels use high.
This is not a contradiction. It is the normal logic of scale. Efficiency works at the level of intensity; total consumption depends on intensity multiplied by scale. If scale rises faster than intensity falls, total demand still increases. That is one of the most important conceptual tools in energy economics, and it helps explain why many countries can look more efficient while still contributing to high global consumption totals.
For readers, the practical message is simple: do not mistake better efficiency for guaranteed lower total use. It may lower the slope of demand growth, and over time that is very important. But in a growing world economy, it does not automatically produce near-term aggregate decline.
What import-dependent economies should learn from these data
Import-dependent economies face a very specific challenge in a high-consumption world. They do not just live with their own demand. They live with the price consequences of everyone else’s demand as well. That is why countries like India must read global fuel-consumption data differently from producer economies.
When world consumption remains high, the import-dependent country is more exposed to freight costs, refining margins, exchange-rate pressure and global supply shocks. Even if its own demand is well managed, it can still face strain because the international market clears at a price shaped by global conditions.
This is one reason India’s import-dependence figure is so important. High domestic consumption plus high import dependence means global fuel demand is not an abstract chart for India. It is a strategic variable. It affects inflation management, external balances, energy planning, subsidy trade-offs and political room for manoeuvre.
What producers, refiners and traders learn from the same data
The same six-year series also means different things to different actors in the energy chain. Producers read it as a sign that the market still requires substantial upstream and export capacity. Refiners read it as evidence that product demand remains relevant, but the product mix and regional demand growth require more precise planning. Traders read it as confirmation that demand, disruption and route risk can coexist at high levels.
For producers, the central lesson is that demand has not disappeared. For refiners, the central lesson is that quality and geography matter as much as quantity. For traders and shippers, the central lesson is that market tightness can be driven by route risk and timing even when aggregate demand only changes modestly.
This is why the world of fuel consumption cannot be analysed only through one discipline. It sits at the intersection of energy economics, trade, logistics, macroeconomics and policy. Professional content becomes stronger when it reflects that complexity without becoming unreadable.
A practical framework for reading fuel stories beyond 2026
Readers who want to continue tracking this subject beyond this article can use a simple professional framework.
Start with the total annual number, but never stop there. Then ask four follow-up questions. First: is the figure observed or forecast? Second: which regions are driving the change? Third: is transport, petrochemicals or industry the main source of support? Fourth: what role are policy, EV adoption, efficiency or disruption playing in changing the slope of growth?
If you ask those questions consistently, you will avoid the two most common mistakes in fuel analysis: exaggerating decline and exaggerating permanence. The market is changing, but it is not yet small. The transition is real, but it is not yet complete. Both can be true together.
Extended conclusion: what the six-year window really shows
A six-year window is long enough to show direction but short enough to preserve detail. From 2021 to 2026, the direction is clear: global fuel use remains very high, and on the annual oil/liquid-fuels series used here it continues to rise. But the texture of that rise changes. Early years reflect reopening and recovery. Middle years reflect expansion in a still fuel-intensive global system. Later years reflect resilience under rising transition pressure and geopolitical stress.
That is the central professional conclusion. Fuel consumption is no longer a simple growth story, but it is not yet a simple decline story either. It is a story of persistence under transformation. The world is adding cleaner systems without yet having removed enough old systems to make aggregate liquid-fuels demand fall decisively in the near term.
For businesses, this means planning must incorporate both realities: fuel demand remains operationally critical, and transition pressure remains strategically unavoidable. For governments, it means resilience and transition policy must move together, not one after the other. For readers and analysts, it means the right way to think about global fuel consumption is not through slogans, but through structured, annual, region-aware and sector-aware interpretation.
That is why this subject matters so much. Fuel consumption is not only about barrels and charts. It is about how the modern economy still moves, and how difficult it is to change that motion without changing the underlying systems that produce it.
Country profiles: why the United States still matters
The United States remains the single largest country-level oil consumer in the 2024 table used here, at roughly 19.0 million barrels per day. That number matters because it reminds readers that mature economies do not disappear from the fuel map simply because they become more efficient or more policy-active. The U.S. is large, vehicle-intensive, freight-intensive and economically diversified. It also has a large petrochemical base and a transport system that still consumes enormous volumes of liquid fuels.
For the global market, U.S. demand matters in a very specific way. It is not usually the fastest structural growth story, but it is still large enough that small percentage changes create meaningful absolute changes. It also helps anchor product demand in the Atlantic Basin and remains one of the most important reference points for market sentiment, refining margins and policy signalling.
Country profiles: why China changes the whole discussion
China is the second giant in the consumption table and arguably the most strategically complex one. It remains a huge oil consumer while also leading in several transition-linked technologies, especially EV deployment. That combination means China often sends mixed signals to the global market. It can be both a high-consumption hydrocarbon economy and a rapid adopter of electrified transport and clean manufacturing technologies.
This is exactly why professional content should avoid using China as proof of only one narrative. China does not prove that oil is finished, and it does not prove that electrification is irrelevant. It proves that very large systems can consume vast quantities of fuel while also pushing transition technologies at scale. That dual reality is uncomfortable for simplistic storylines, but it is ideal for honest analysis.
Country profiles: why India is the most important swing market for many readers
India deserves separate attention because it combines three features that make it pivotal: large absolute demand, rising development needs and high import dependence. Unlike some mature markets, India is still in a phase where mobility demand, freight intensity, urbanisation and industrial expansion can all support continuing fuel use. Unlike some producer economies, India cannot easily shield itself from global disruptions simply by leaning on domestic crude abundance.
That means India is one of the clearest examples of how a country can simultaneously want lower fuel vulnerability, faster clean-energy deployment and continued economic expansion. It is not a contradiction; it is the core policy problem. The country needs growth, but growth has historically been energy-intensive. It wants resilience, but resilience is expensive. It wants cleaner systems, but cleaner systems must be built at scale and at speed to make a real dent in import vulnerability.
How policy influences consumption without always reducing it immediately
One of the subtler lessons in fuel analysis is that policy works through many channels, and not all of them show up instantly as lower total demand. Governments can influence fuel use through taxes, subsidies, fuel-efficiency standards, public transport investment, urban design, electrification support, refinery policy, strategic reserves, export controls and emergency conservation measures.
Some of those policies affect price. Some affect technology adoption. Some affect infrastructure. Some only matter during crises. This is why it is too simplistic to ask whether policy “works” by looking only at the next annual demand number. A government that pushes EVs, efficiency and mass transit may change the long-run slope of fuel demand without producing a dramatic one-year collapse in consumption. A government that intervenes during a shortage may slow growth in one forecast year without changing the deep structure of the system.
The EIA’s 2026 outlook is useful precisely because it shows policy entering the demand discussion explicitly. Government initiatives to reduce fuel use are part of the explanation for slower forecast growth. That is a strong signal that policy now affects not only transition narratives, but also near-term fuel forecasting.
Why charts and long-form context belong together
Readers often assume charts tell the truth on their own. They do not. Charts show shape, scale and comparison, but they still need interpretation. A rising line can mean resilience, overshoot, delayed transition or simple economic recovery depending on context. A regional-share chart can imply concentration, but without narrative it cannot explain why a region is large or what kind of demand dominates there.
That is why serious long-form writing should pair visuals with explanation. The charts in this article are not decoration. They are reference points. The line chart shows the recovery-and-growth arc. The regional-share chart shows where consumption is anchored geographically. The country chart shows why the U.S., China and India remain so central. The paragraphs around them then turn those visuals into insight.
Limitations and how to read the data responsibly
No single fuel-consumption article can erase all definitional issues, so a responsible writer should state the limitations directly. First, the historical 2021-2024 series and the 2025-2026 forecast series come from different institutions and slightly different framing conventions, even though both are authoritative and both are widely used in global energy analysis. Second, oil consumption and liquid-fuels consumption are not identical in every technical respect. Third, forecast values can change with each major new outlook.
None of these limitations makes the analysis invalid. They simply mean that readers should use the figures as part of a transparent framework rather than as if they were a single perfect dataset with no methodological differences. In professional work, clarity about the boundaries of the data increases credibility rather than reducing it.
What businesses, policymakers and citizens should take away
Businesses should take away that fuel demand remains large enough to affect cost planning, logistics, pricing strategy and risk management well beyond the immediate future. Policymakers should take away that resilience and transition cannot be sequenced lazily; they must be built together. Citizens should take away that global fuel consumption is not a distant market statistic but a force that influences inflation, freight costs, airline prices, public finance and national energy security.
The most important practical conclusion is that the world is not choosing between “all fuel” and “no fuel” in the immediate term. It is managing a difficult overlap between the fuel-heavy system it still relies on and the lower-carbon system it is trying to build. Understanding that overlap is the first step toward interpreting every major energy headline more intelligently.
Appendix: a reader''s checklist for judging any future fuel-consumption story
If you want to keep following this subject after reading this article, there is a simple checklist that will make future stories easier to decode. Ask first whether the article is discussing oil, total liquids, total energy or one retail fuel. Ask second whether the figure is observed or forecast. Ask third which sectors are doing the work in the background: road transport, aviation, shipping, petrochemicals, industry or power. Ask fourth which regions are moving most. Ask fifth whether the story is driven by price, policy, disruption or technology.
That checklist may sound basic, but it is powerful because it prevents the two biggest interpretation errors. One error is to overreact to a single dramatic price move and assume demand has collapsed. The other is to overreact to one year of rising consumption and assume transition forces are irrelevant. Good analysis resists both.
The deeper point is that fuel consumption is not a one-number subject. It is a system subject. The more a reader learns to read it in layers — total, regional, sectoral, policy and technological — the more useful every future headline becomes.
Closing perspective
From 2021 to 2026, the world moved from post-pandemic repair to high-demand resilience under transition pressure. That is the cleanest summary of the period. The path was not straight, and the reasons behind the numbers changed from year to year. But the overall message is remarkably consistent: the world still consumes an immense quantity of fuel, and understanding how that quantity changes is essential for understanding inflation, growth, transport, trade and energy security.
That is why a careful global fuel-consumption article should never be treated as niche reading. It is, in reality, a map of how the modern world still functions.
One final comparison that professionals never ignore
There is one last comparison worth making because it captures the heart of the subject. In 2021, the big question was whether fuel demand would recover. By 2024, the question had become whether fuel demand could remain high while clean-energy deployment accelerated. By 2026, the question is changing again: how long can high fuel demand persist in a world where policy, technology and disruption all increasingly push against the old model at the same time?
That evolution in the question is as important as the numbers themselves. Mature analysis is not only about measuring the market; it is about understanding which question the market is now forcing us to ask. The 2021 answer was recovery. The 2024 answer was persistence. The 2026 answer is pressure. Put together, those three words explain the entire six-year window.
And that is precisely why the data matter beyond the energy industry. A recovering market changes business expectations. A persistent market changes investment logic. A pressured market changes policy behaviour. Readers who understand those shifts are better equipped to understand why fuel, inflation, shipping, mobility, trade and politics keep colliding in headline after headline.
For a subject that is often reduced to slogans, that kind of disciplined reading is a competitive advantage. It helps readers distinguish signal from noise and trend from temporary drama.
In energy, as in markets, the best conclusions usually come from respecting complexity rather than running away from it.
That is the real purpose of this blog: clarity with context.
AP reported a severe bus and fuel-tanker collision in Indonesia in May 2026 with multiple fatalities, underscoring route safety and hazardous-freight risk governance.
Autocar India reported Triumph Tiger 900 Alpine and Desert editions from around Rs 15.35 lakh, reinforcing premium bike strategy amid cost-sensitive buying cycles.
Autocar India reported the reveal of updated Tiago and Tiago EV ahead of the 28 May launch window, adding a fresh affordability-versus-running-cost debate.
CarWale mileage testing coverage on 25 May 2026 renewed focus on real-use efficiency, a critical metric in an environment of volatile fuel and ownership costs.