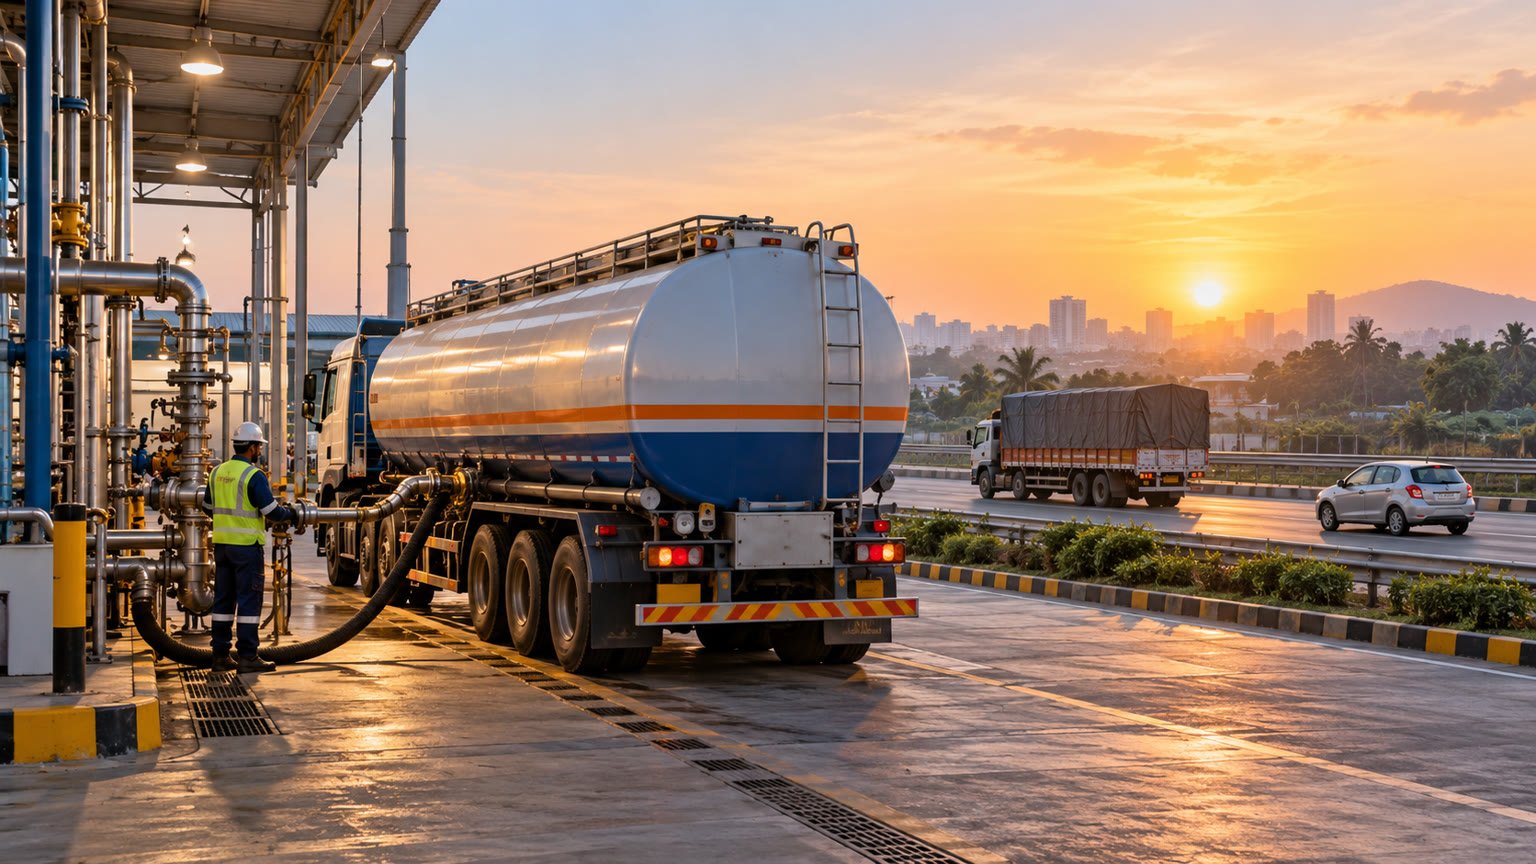
India’s diesel consumption rose 11.69% year on year in October 2026 while petrol consumption grew 3.11%, according to PPAC data cited independently by Business Standard and The Economic Times. For drivers, this is a demand signal—not a pump-price revision: it points to stronger freight and festive activity, but it does not change the amount charged at a petrol pump by itself.
Key takeaways
- Diesel consumption increased 11.69% year on year in October 2026; petrol consumption rose 3.11%.
- Diesel’s monthly growth was above its 5.91% April–October pace, while petrol’s was below its 6.53% cumulative growth.
- The figures describe fuel use, not a new tax, retail-price order or automatic increase in a driver’s bill.
- Households and fleets should use their local pump price, actual mileage and route distance to plan costs.
What the October fuel data shows
The figures were reported on 1 November 2026 from fresh data attributed to the Petroleum Planning and Analysis Cell (PPAC), the Ministry of Petroleum and Natural Gas’s data agency. Business Standard reported the exact changes as 11.69% for diesel and 3.11% for petrol in October 2026, while The Economic Times reported the same movement rounded to 11.7% and 3.1%.
| Fuel | October 2026 YoY change | April–October 2026 YoY change | Reader context |
|---|---|---|---|
| Diesel | Up 11.69% | Up 5.91% | A stronger month than the seven-month cumulative pace. |
| Petrol | Up 3.11% | Up 6.53% | Growth was positive, but slower than the April–October pace. |
All four percentage figures are year-on-year comparisons for the periods stated above. The difference between the monthly and cumulative rates is useful context, but it is not a forecast for November and does not establish what any individual city will consume.
Why diesel demand rose faster
The Economic Times attributed the October diesel increase to festive-season goods movement and broader economic activity. That reading fits the way diesel demand reaches FuelPrice readers: trucks move inventory, construction and service vehicles run more often, and buses and commercial vehicles cover more kilometres during a busy travel and delivery period.
The important distinction is between national consumption and an individual fleet’s efficiency. More diesel sold across India can reflect more vehicle activity, longer routes, inventory movement or a shift in where operators buy fuel. It does not mean every truck used 11.69% more diesel, and it does not prove that every driver’s monthly bill rose by the same percentage.
For transporters, the data is best treated as a market signal to compare with their own records: litres purchased, kilometres covered, payload, idling time and the price paid at each location. A fleet whose work increased may see higher fuel volume even if its vehicles became more efficient. A fleet facing more congestion may see the reverse.
What the petrol number says about everyday driving
Petrol consumption also grew in October, but the 3.11% year-on-year increase was below the 6.53% growth reported for April–October 2026. The Economic Times linked the moderation partly to the increasing presence of CNG-powered vehicles in new-vehicle sales. That is an attributed explanation, not a conclusion that applies equally to every state or city.
For a private motorist, the national figure cannot replace a local check. Petrol use varies with commuting patterns, vehicle mix, traffic, holiday travel and the number of kilometres driven. The number that belongs in a trip budget is the vehicle’s expected litres for that route multiplied by the current local price—not the national year-on-year demand rate.
Before a long drive, the fuel-cost calculator can help separate a route’s fuel estimate from assumptions about national demand. This keeps a macroeconomic signal from being mistaken for a personal price quote.
The wider fuel market was mixed
The same PPAC-linked reports did not show a uniform rise across every petroleum product. Business Standard reported LPG consumption down 12.11% year on year in October 2026, while aviation turbine fuel (ATF) demand fell 1.34%. The Economic Times reported the LPG decline at 12.1% and ATF at 1.3%.
That mixed pattern matters because fuel demand is not one single market. Road fuels can strengthen while cooking gas or aviation fuel moves differently, depending on supply conditions, travel, industrial activity and the product’s end use. The October data therefore supports a careful conclusion: road-fuel use was stronger, especially for diesel, while the wider petroleum basket remained uneven.
It also does not announce a shortage or a retail-price change. The official PPAC tracker publishes monthly consumption and other oil-and-gas information, but a demand release is separate from any notification by an oil marketing company or a government decision on taxes and retail prices.
What this means for drivers and fleet operators
For private drivers
The immediate effect is informational, not a new charge. A rise in national petrol demand does not automatically change the rate on a city pump. Drivers should check the dated rate for the city where they plan to fill up on the live fuel-prices page, then use the vehicle’s own mileage and planned distance to estimate the trip.
For freight and commercial users
Diesel demand is a reminder to watch both fuel volume and operating conditions. If festive dispatches or route changes increase kilometres, the total bill can rise even when the per-litre rate is unchanged. Toll charges, loading delays, detours and idling can also change the cost of a diesel trip, so a fleet review should not attribute every movement in monthly spending to fuel price alone.
For a route with several cost components, the road-trip planner can help compare distance and travel choices before adding the latest fuel estimate. The result is still an estimate; actual consumption depends on vehicle condition, load, traffic, speed and weather.
What to watch next
The next useful check is whether diesel growth remains above its April–October pace in later monthly data, and whether petrol growth continues to moderate as the vehicle mix changes. Those are watchpoints, not predictions. Readers should also watch for separately dated changes in retail petrol, diesel or CNG prices, because consumption data alone cannot establish a pump-price move.
For policymakers and the transport industry, the more important question is whether stronger diesel use reflects durable freight activity or a short festive-season spike. A few months of data, combined with freight movement, vehicle registrations and local fuel-price trends, will give a clearer picture than one month on its own.
The reader takeaway is simple: October’s PPAC-linked data shows stronger road-fuel use, led by diesel, but it does not add a surcharge to your next fill. Plan with the price at your pump, the mileage of your vehicle and the route you will actually drive.
Sources
- Business Standard: “Diesel consumption rises 11.69% in October, LPG demand falls 12.11%” — 1 Nov 2026
- The Economic Times: “Diesel sales surged 11.7%, petrol 3.1% in October” — 1 Nov 2026
- Petroleum Planning & Analysis Cell: “Snapshot of India’s Oil and Gas Data” and official tracker — accessed 2 Nov 2026