Mahindra has crossed the six-lakh SUV dispatch mark in calendar 2026, with 6,15,280 units reported for January–October, according to Autocar India and Aaj Tak. The milestone followed a record 73,338 domestic SUV wholesales in October, but dispatches should not be read as a count of individual customer deliveries.
Key takeaways
- Mahindra’s reported January–October 2026 SUV wholesales reached 6,15,280 units, up 19% from 5,18,321 in the same period of 2025.
- The company’s November 1 stock-exchange filing recorded a record 73,338 domestic utility-vehicle sales in October, up 2% year on year.
- Mahindra’s filing uses an April–October financial-year measure: 4,31,480 utility vehicles in FY27 to date, up 17% from 3,69,194.
- The XUV 3XO ZNG is Mahindra’s first CNG vehicle, and the company said it had seen strong customer traction; no model-wise sales split was disclosed.
- For buyers, the milestone is a demand signal, not a promise of a shorter waiting period, a discount or a particular variant being available locally.
What Mahindra’s six-lakh milestone means
Autocar India reported that Mahindra’s SUV wholesales for January to October 2026 stood at 6,15,280 units, compared with 5,18,321 in January to October 2025. That is a 19% year-on-year increase. Aaj Tak’s November 12 report carried the same calendar-year total and described it as Mahindra’s second consecutive year above the six-lakh mark.
The comparison is with Mahindra’s 2025 full-year SUV figure of 6,25,603 units. At the beginning of November, the company was reported to be 10,323 units short of matching that total; the January–October 2026 number has now moved past the six-lakh threshold with two months still left in the calendar year.
Mahindra’s official filing provides a useful measurement distinction. Its table is labelled FY27 and covers the financial year to October, rather than January to October. It shows 4,31,480 domestic utility-vehicle sales for that period, against 3,69,194 a year earlier, a 17% increase. For October alone, the filing records 73,338 domestic utility-vehicle sales against 71,624 in October 2025, a 2% rise. The calendar-year and financial-year totals describe different windows, so they should not be added together or compared as if they were the same measure.
Why dispatches are not the same as deliveries
Monthly manufacturer figures generally describe vehicles sold or dispatched into the domestic channel. A wholesales milestone can show that the company is moving a large volume of vehicles through its network, but it does not tell a buyer how many vehicles were registered with customers, how many units are waiting at a particular dealer or which variants have the shortest queue.
That distinction matters when a popular SUV is being considered. A strong company-wide number can coexist with different waiting periods for petrol, diesel, CNG and electric versions, and for different cities. It can also reflect a mix of established models, new launches, fleet purchases and festive-season dispatches. Buyers should therefore treat the six-lakh figure as market context and verify the exact variant, manufacturing month, quoted delivery window and on-road price with the selling outlet.
Why the CNG SUV matters to running-cost comparisons
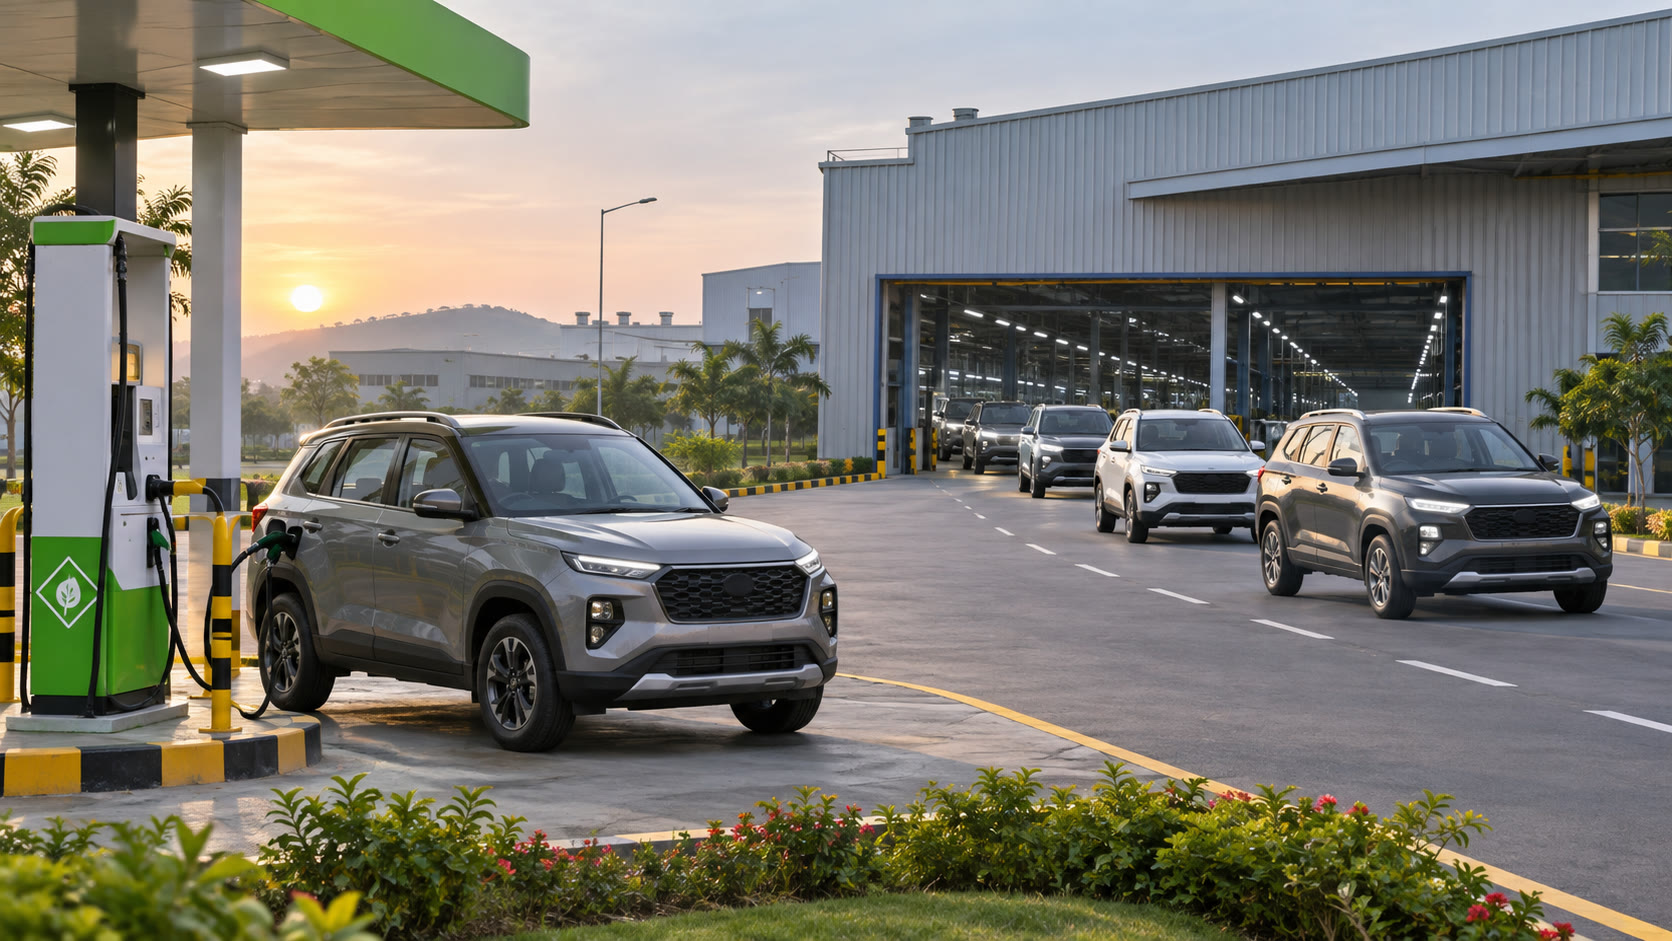
Mahindra’s official October release said its first CNG vehicle, the XUV 3XO ZNG, had seen strong traction after launch. The company did not publish a CNG-versus-petrol sales split, so the overall six-lakh number cannot be used to measure demand for that variant alone.
For a driver covering a high monthly distance, the more useful comparison is the vehicle’s actual route pattern, the local CNG rate and access to refuelling. Claimed fuel economy is a test figure and may not match traffic-heavy use, full loads or frequent short trips. The CNG prices in all cities page can help check the current local rate, while the fuel cost calculator can compare a typical trip or monthly distance across fuel choices.
Customers weighing a CNG SUV against an electric alternative should also map the practical refuelling or charging network before comparing headline running costs. The EV charging directory is useful for checking charging access by state. These checks are more meaningful than assuming that a manufacturer’s sales momentum automatically makes one powertrain the right fit for every owner.
What buyers should check now
- Confirm the metric. Ask whether a sales claim refers to factory dispatches, dealer wholesales, retail deliveries or registrations.
- Check the exact vehicle. Confirm the fuel type, variant, transmission and the manufacturing month on the quotation and delivery documents.
- Use current local prices. Recalculate the cost for the distance actually driven instead of relying only on a claimed mileage figure.
- Verify access. CNG availability, charging access, service reach and typical route conditions can change the practical value of a powertrain.
- Watch the delivery terms. A record for the brand does not by itself guarantee stock, a discount or a fixed delivery date for a particular SUV.
What to watch next
Autocar India said Mahindra was on course to cross seven lakh SUV wholesales in calendar 2026 and could approach 7.5 lakh if the current pace continued. That is a reported projection, not a company guarantee. The more useful follow-up will be whether November and December dispatches are matched by retail registrations, whether the XUV 3XO ZNG sustains its early traction and how the broader mix of combustion, CNG and electric vehicles changes.
For vehicle buyers, the practical takeaway is simple: Mahindra’s six-lakh milestone confirms strong momentum in its SUV business, but the right purchase comparison still depends on the vehicle’s exact price, fuel cost, availability, service access and usage pattern.
Sources
- Mahindra & Mahindra: “Mahindra Auto records highest ever SUV domestic sales of 73338 vehicles and total volumes of 131109 in October 2026” — 1 Nov 2026
- Autocar India: “Mahindra crosses 6 lakh SUV sales for second year in a row” — 12 Nov 2026
- Aaj Tak: “Mahindra की रिकॉर्ड तोड़ बिक्री... 6 लाख से ज्यादा ने खरीदी SUVs” — 12 Nov 2026