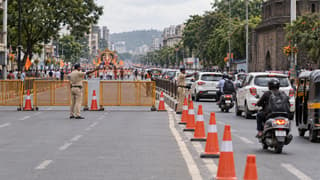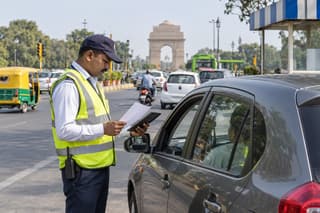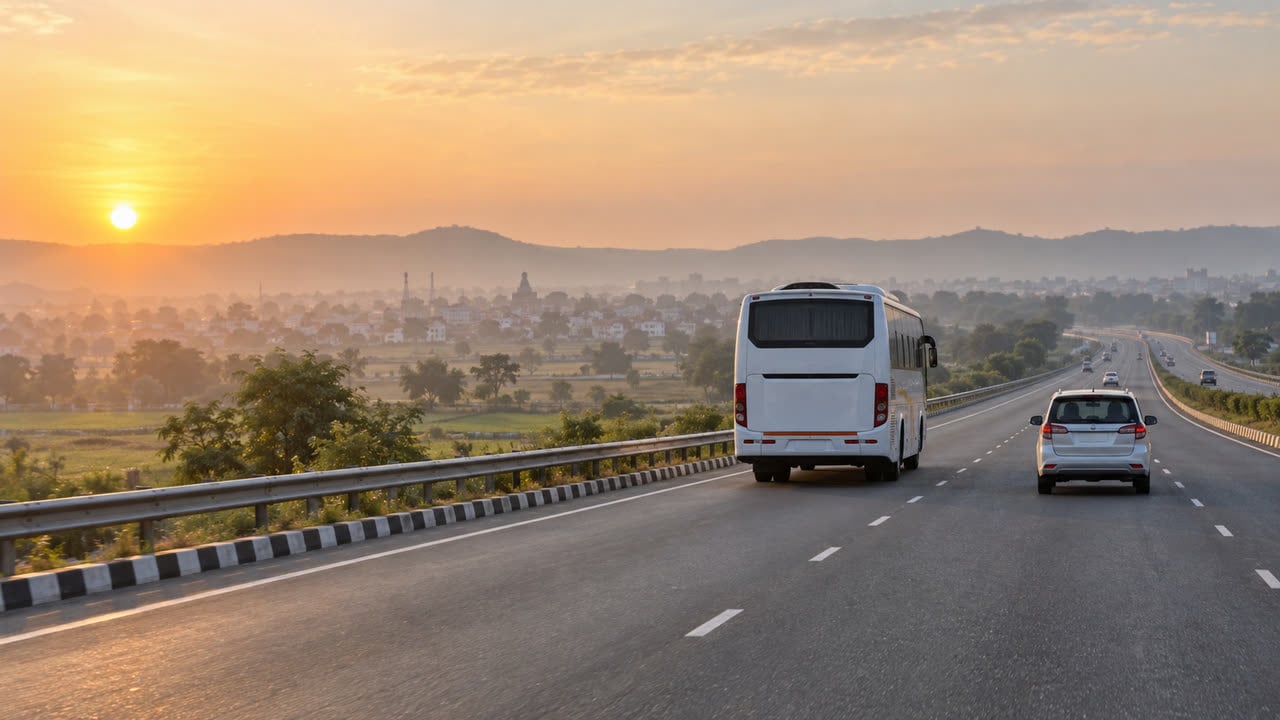
 Illustrative image generated for FuelPrice; not an official survey photograph.
Uttar Pradesh accounted for 15.7% of India’s domestic overnight visitor-trips in the latest National Statistics Office (NSO) survey, ahead of Tamil Nadu and Rajasthan. For people planning a road journey, the same release shows a clear split between bus-led rural travel, train-led urban travel and transport-heavy leisure budgets, making route and trip-cost planning more useful than relying on a destination ranking alone.
Key takeaways
- Uttar Pradesh had the largest share of visitor-trips in the survey’s 365-day overnight-travel group at 15.7%, followed by Tamil Nadu at 13.4% and Rajasthan at 8.0%.
- Pilgrimage and religious travel accounted for 48% of overnight trips in that group, while social travel made up 89% of overnight trips in the separate 30-day group.
- Buses were the leading mode for rural households at 32%; trains led urban travel at 35% for the 365-day overnight category.
- About 80% of overnight visitors stayed for five days or less, and transport took the largest share of spending on holiday, leisure and recreation trips.
What the NSO survey measured
MoSPI released the Domestic Tourism Expenditure Survey findings on 23 Sep 2026. The survey was conducted from July 2025 to June 2026 as part of the 80th National Sample Survey round and covered 24,778 first-stage sampling units and 2,46,113 households across India, excluding villages in the Andaman and Nicobar Islands that were difficult to access throughout the year.
It is important to understand the survey’s two reference windows. One set of questions covered overnight trips completed in the previous 365 days for holidaying, leisure and recreation, pilgrimage and religious travel, health and medical visits, and shopping. A separate set covered overnight trips in the previous 30 days for business, social, education and training, and other purposes. Same-day trips were measured separately.
That means the survey is a picture of household travel behaviour, not a live count of cars on highways or fuel sold at petrol pumps. Its value for drivers is that it shows the purposes, timing, modes and spending patterns behind domestic movement.
UP leads the destination ranking, with an important caveat
When visitors travelling within their home state and from outside it were combined, Uttar Pradesh recorded 15.7% of visitor-trips in the 365-day category. Tamil Nadu followed at 13.4% and Rajasthan at 8.0%, according to the NSO release and independent reporting by Business Today and The Times of India.
UP also led the separate 30-day category, with 15.5% of visitor-trips. Bihar stood at 10.5% and Tamil Nadu at 9.6% in that group. These are shares of survey-defined visitor-trips, not shares of all road traffic, fuel consumption or toll collections. A state can rank high on visitor-trips without every journey being made by private car.
What the travel modes mean for road users
For the 365-day overnight-trip group, buses accounted for 32% of visitor-trips among rural households, while trains accounted for 35% among urban households. In the separate 30-day group, buses were the most-used mode for both rural and urban households, with shares of 48% and 44% respectively.
The numbers point to a useful difference between travel demand and car demand. Domestic movement is not the same as private-vehicle movement. For road-trip planners, the practical question is therefore not only where people are going, but also which journeys are likely to be road-based, how many people are travelling together and how long they stay.
The survey recorded an average trip size of 2.03 overnight visitors. Around 80% of visitors stayed for five days or less, while May and October were the peak months for holidaying, leisure and recreation travel in the 365-day reference period. Those details can help a traveller think about fuel, tolls, stopovers and return timing without assuming that every popular destination produces the same kind of road demand.
Transport is a major part of the trip budget
The NSO release says transport accounted for the highest share of expenditure on overnight trips whose leading purpose was holidaying, leisure and recreation. That is directly relevant to FuelPrice readers: a destination’s headline popularity does not tell you what the journey will cost.
Health and medical trips recorded the highest average expenditure in the 365-day group, at ₹29,454 for rural households and ₹41,649 for urban households. In the 30-day group, business trips recorded the highest average expenditure at ₹5,949 per trip overall; the rural and urban figures were ₹5,179 and ₹6,934 respectively. These are household survey averages, not a quoted price for a particular route or a guarantee of what any traveller will spend.
For a car journey, readers can enter their vehicle and route details in the fuel cost calculator instead of applying the survey averages directly. A separate check of the toll-charge calculator can show how highway fees change the total. Because pump rates differ by location, the live fuel prices page is the right place to verify the rate used in a trip estimate.
How to use the findings before a trip
- Define the trip purpose and duration. A short social visit, a pilgrimage and a leisure circuit may use different routes and stop patterns even when the destination is the same.
- Choose the travel mode before estimating cost. The survey’s rural and urban split shows why a bus or train journey should not be converted into a private-car budget without checking the actual route.
- Separate fuel from tolls. Add both to the same trip plan so a highway route is compared on total out-of-pocket cost, not fuel alone.
- Plan around the people travelling. An average survey trip size is a national indicator, not a substitute for the passenger count, luggage and vehicle efficiency in your own journey.
For a longer circuit, the road-trip planner can help organise stops and timing around the route. The survey’s strongest lesson is simple: trip planning works better when the mode, purpose, distance and cost are considered together.
What the survey does not prove
The findings do not show that Uttar Pradesh will have the highest highway traffic on every corridor, that bus demand is replacing car demand, or that a particular toll road will become more crowded. They also do not provide a current petrol, diesel or CNG price. Those would require separate, dated evidence from the relevant fuel, toll or transport authorities.
What the survey does provide is a credible national baseline for how Indian households travel. It shows that pilgrimage and religious journeys dominate one overnight-travel group, social trips dominate the more recent 30-day group, and transport is a central part of the leisure budget. For drivers and operators, that is enough to justify more careful trip-cost planning without turning a statistical release into a forecast.
Sources
- Press Note on Domestic Tourism Expenditure Survey July 2025 to June 2026 — Press Information Bureau, 23 Sep 2026
- Domestic tourism: Nearly 1 in 2 overnight trips in India are for pilgrimage, religious purposes — Business Today, 23 Sep 2026
- UP tops India for domestic overnight travel, outpacing Tamil Nadu and Rajasthan: NSO — The Times of India, 25 Sep 2026