India’s PM E-DRIVE dashboard reported an estimated 31,31,905 litres of fuel saved per day as of 26 Sep 2026, alongside a daily carbon-dioxide reduction estimate of 38,55,532 kg. For Indian drivers, the update shows the scheme’s effect at fleet scale, while also making clear that an aggregate fuel-saving estimate is not a direct cash saving for every EV owner or a change in petrol and diesel prices.
Key takeaways
- The Ministry of Heavy Industries dashboard is dated 26 Sep 2026 and reports 31,31,905 litres of daily fuel saving.
- The same dashboard reports 38,55,532 kg of daily CO₂ reduction; NDTV reported the two figures in rounded form as 31.3 lakh litres and 38.5 lakh kg.
- The estimate covers the wider PM E-DRIVE and EMPS-supported EV base, not one vehicle, one city or one fuel station.
- Actual running-cost outcomes still depend on vehicle efficiency, electricity tariffs, charging access, distance travelled and usage pattern.
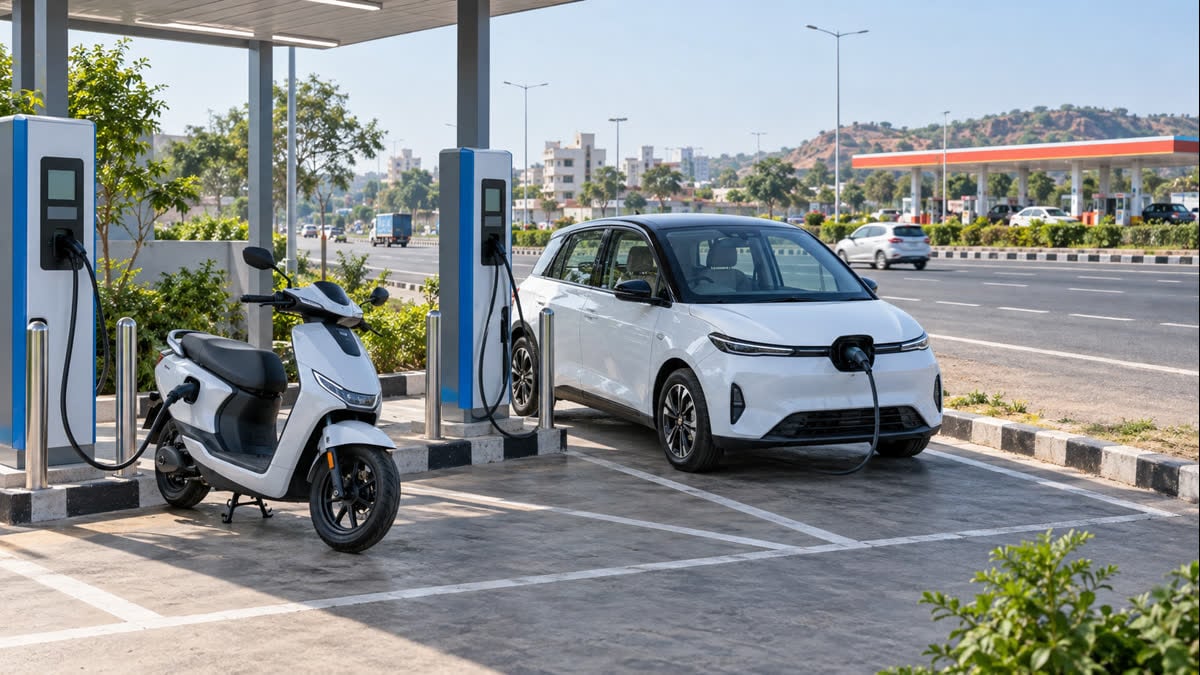
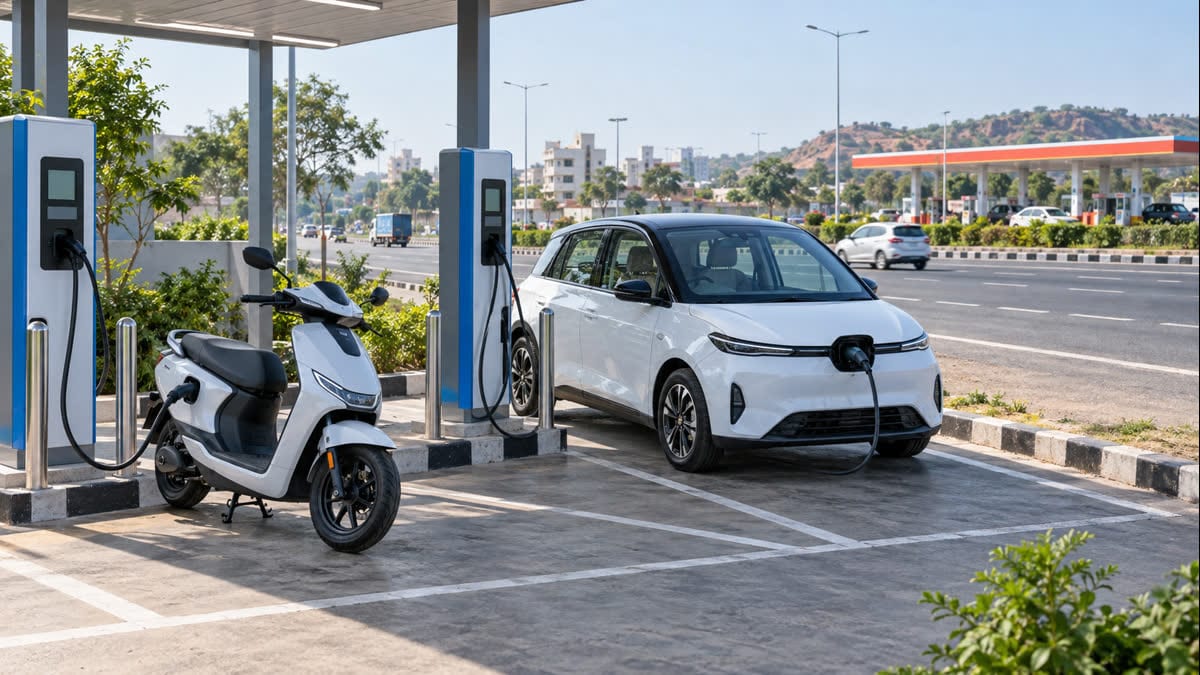 AI-generated editorial illustration of public EV charging; it is not an official PM E-DRIVE photograph. Credit: FuelPrice.
What changed in the latest PM E-DRIVE update
The Ministry of Heavy Industries’ official sales dashboard is marked “as on date 26-09-2026”. It lists the scheme-level fuel and emissions estimates separately from the vehicle-registration table, which is important when interpreting the figures.
| Dashboard measure | Latest reading | What it means |
|---|---|---|
| Fuel saving per day | 31,31,905 litres, as of 26 Sep 2026 | The Ministry of Heavy Industries’ aggregate estimate for fuel displaced by supported EV use; NDTV reported the rounded figure as 31.3 lakh litres per day. |
| CO₂ reduction per day | 38,55,532 kg, as of 26 Sep 2026 | The dashboard’s corresponding daily estimate; NDTV reported the rounded figure as 38.5 lakh kg per day. |
The two reports are consistent apart from rounding and presentation. The dashboard is the primary source for the exact readings, while NDTV provides an independent explanation of what the update means and places it in the scheme’s second-year context.
Why the fuel figure matters to drivers
Fuel displacement is easier to understand at the scale of daily travel than as a promise about an individual vehicle. Every trip made by an EV instead of a petrol or diesel vehicle can reduce liquid-fuel use, but the national estimate combines many vehicle categories and driving patterns. It cannot be divided evenly among owners.
That distinction matters for buyers comparing running costs. A scooter used for short urban commutes, a delivery three-wheeler and a private electric car can have very different charging needs. Electricity tariffs, home-charging availability, public-charger pricing, vehicle efficiency and annual kilometres will change the result. The dashboard figure therefore indicates an overall direction of travel, not a guaranteed monthly saving.
It also does not mean petrol or diesel prices have fallen. Pump prices remain determined by the applicable taxes, crude and product-market conditions, currency movements and oil-company pricing decisions. Readers comparing an existing petrol or diesel vehicle with an EV can use FuelPrice’s fuel cost calculator to set out the liquid-fuel portion of a trip before adding their own electricity and charging assumptions.
PM E-DRIVE covers more than private cars
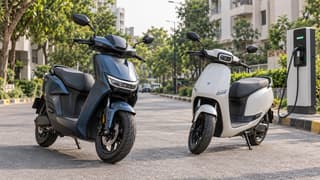
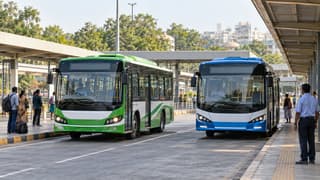
The official PM E-DRIVE scheme overview lists electric two-wheelers, three-wheelers, e-ambulances, e-trucks, e-buses, public charging infrastructure and testing-agency upgrades among its supported categories. That breadth explains why the dashboard’s fuel estimate should be read as a mobility-system measure rather than a private-car statistic.
For commercial and last-mile operators, the relevant question is often vehicle utilisation and charger downtime rather than headline range. A vehicle that runs many daily kilometres may have a different fuel-displacement profile from a privately owned EV that is used occasionally. The same principle applies to buses and trucks: route length, payload, charging turnaround and depot power supply affect the operational result.
FuelPrice’s earlier PM E-DRIVE e-2W adoption update covered the scheme’s two-wheeler penetration and target. This latest dashboard update adds the broader fuel and emissions lens, so the two figures should not be treated as duplicate measures of vehicle sales.
What EV users can check now
The national estimate does not answer whether a particular charger will be available on a particular trip. EV owners planning an intercity journey can check the state-wise EV charging directory, confirm the connector and charging-speed details where available, and keep a practical alternative stop in mind when route conditions change.
Trip planning also needs a clear separation between the vehicle’s energy cost and other road-trip expenses. The road-trip planner can help structure distance and stops; the final comparison should use the vehicle’s own efficiency, the electricity tariff or public charging rate and the fuel price applicable to the alternative vehicle.
What to watch next
The next useful updates will be changes in the official dashboard’s daily estimates, clearer segment-wise reporting and more information on how registered vehicles translate into actual kilometres travelled. Public-charging availability and reliability will matter alongside the number of vehicles receiving support, because a growing EV fleet needs dependable places to recharge.
For now, the responsible reading is straightforward: PM E-DRIVE’s latest official dashboard shows a measurable scheme-level reduction in estimated liquid-fuel use, but it does not forecast pump prices or guarantee a particular owner’s savings. The figure is most useful as a national mobility signal and as a prompt to compare real vehicle, charging and trip data before drawing a personal cost conclusion.
Frequently asked questions
Does the daily fuel-saving figure mean every EV owner saves the same amount?
No. It is an aggregate estimate based on the supported EV base and the assumptions used by the dashboard. Individual outcomes depend on kilometres, vehicle efficiency, charging price and the petrol or diesel vehicle being compared.
Is the dashboard figure a cash benefit paid to EV owners?
No. The fuel and CO₂ readings describe estimated system impact. They are separate from any purchase incentive or scheme process and should not be read as a direct payment or monthly credit.
Sources
- Ministry of Heavy Industries — PM E-DRIVE Sales Dashboard — 26 Sep 2026
- NDTV — PM e-DRIVE Nears Two Years: How Much Fuel And Carbon Emissions Are EVs Saving Every Day? — 26 Sep 2026
- Press Information Bureau, Ministry of Heavy Industries — PM E-DRIVE Scheme and Promotion of Electric Mobility — 28 Jul 2026