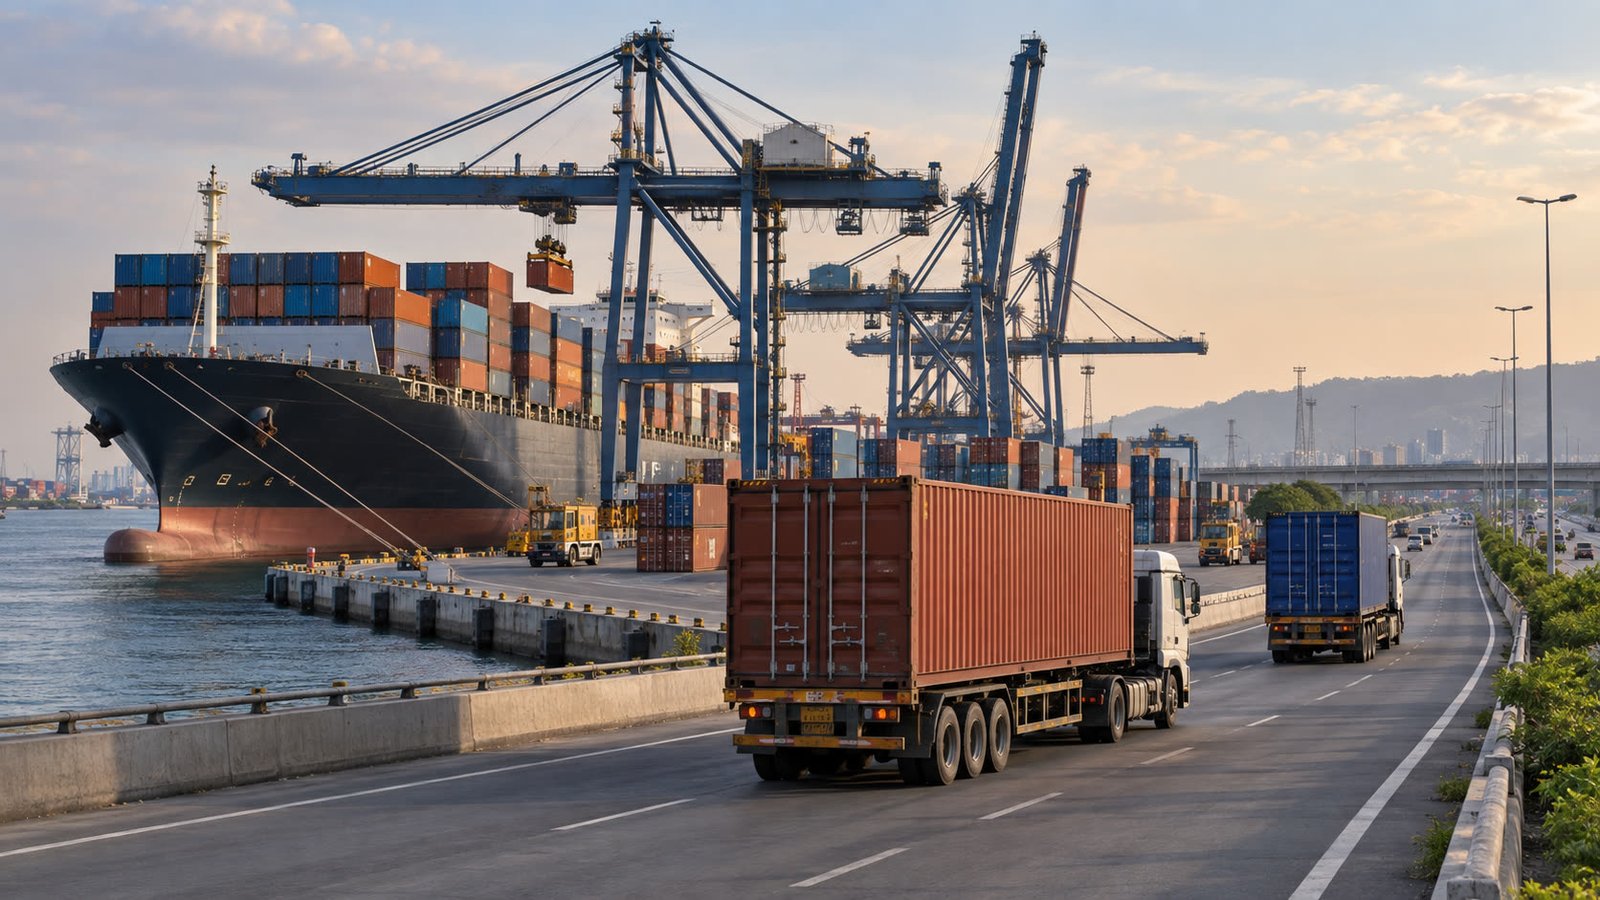
India's port cargo rose about 7% year on year in August 2026, while global container freight rates were reported 132% above February 2026 levels. For Indian transporters and businesses moving goods inland, the split matters: cargo demand is holding up, but shipping and road-linked logistics costs are under pressure. The 132% figure refers to global container freight rates; it does not mean petrol or diesel prices rose by 132%.
Key takeaways
- The Ministry of Ports, Shipping and Waterways recorded 77.41 million metric tonnes (MMT) at major ports in August 2026, up 8.44% from August 2025.
- Non-major ports handled 66.08 MMT in August 2026, up 5.12% year on year, according to the Ministry's advance estimate.
- Adding the two official port groups gives about 143.48 MMT, up 6.88% from 134.24 MMT in August 2025, which rounds to the 7% headline.
- Reports citing Jefferies put global container freight rates 132% above February 2026 levels and said road freight tariffs rose 2% month on month in early September 2026.
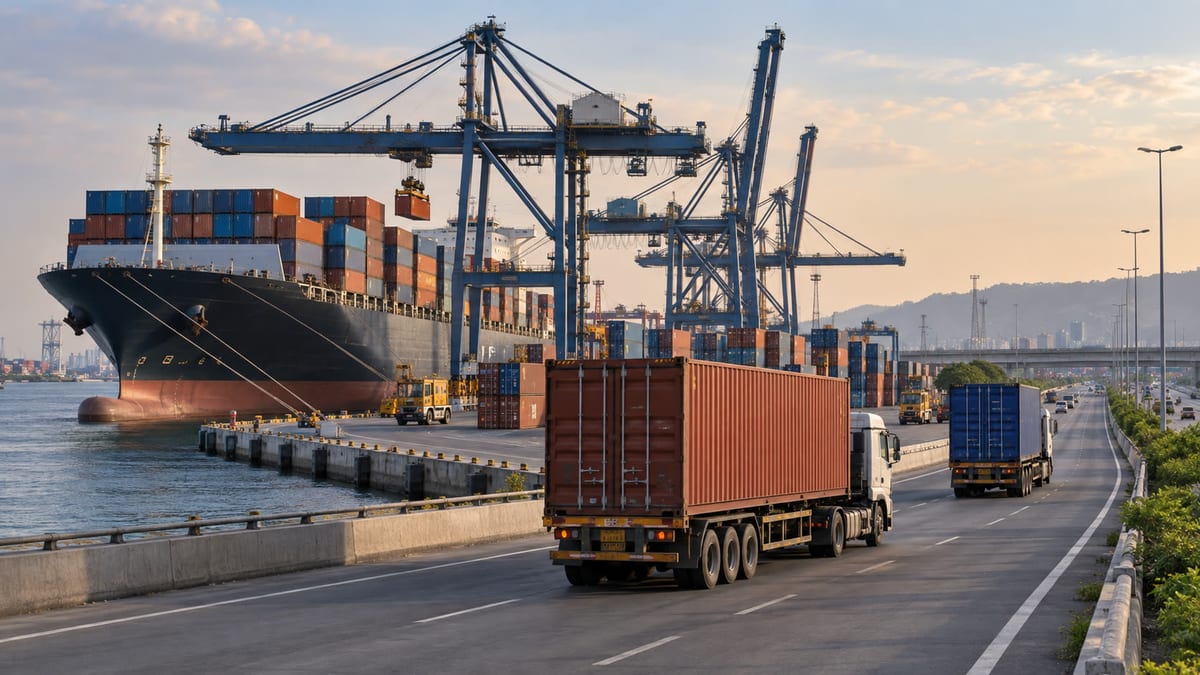 Editorial illustration of the port-to-road freight chain. Credit: FuelPrice editorial illustration, 24 Sep 2026.
What the official port data says
The Ministry's two August 2026 cargo reports use advance estimates for August 2026 and provisional figures for August 2025. They show growth at both parts of India's port network, but at different speeds.
| Port group | August 2026 cargo | Change from August 2025 | Data source |
|---|---|---|---|
| Major ports | 77.41 MMT | +8.44% | MoPSW advance estimate |
| Non-major ports | 66.08 MMT | +5.12% | MoPSW advance estimate |
| Combined calculation | 143.48 MMT | +6.88% | Calculated from the two Ministry reports |
The combined calculation is useful for readers because it explains why the widely reported national figure is described as 7% even though the official reports publish separate major and non-major port totals. It also shows that the growth is not uniform across every port or cargo category.
There is a source difference that should not be hidden. The 23 Sep 2026 ANI report carried by The Tribune and the 24 Sep 2026 report in Maritime Gateway summarise Jefferies as saying major-port volumes rose 10% and non-major-port volumes rose 11% in August. The Ministry's own August tables show 8.44% and 5.12% for those two groups. The difference may reflect different scopes or datasets. This article uses the Ministry's primary advance estimates for port-group figures and labels the Jefferies numbers as reported.
Why global freight rates are under pressure
Jefferies attributed the 132% increase in global container freight rates from February 2026 to Middle East tensions, early peak-season shipments and front-loading ahead of China's Golden Week, according to the recent reports. That combination can make shippers book space earlier, compete for available capacity and pay more for a container even while Indian ports continue to handle growing volumes.
For India, a busy port does not automatically mean cheaper freight. A port can receive more cargo while the cost of moving each container remains elevated. The reported data also points to a change in the balance between modes: port container volumes were reported to have risen 10% year on year in August, while Indian Railways' container volumes fell 3% over the same period. Those figures are from the Jefferies reporting and should be read as a market signal, not as a forecast of every corridor.
What it means for road freight and fuel users
Road tariffs are a separate cost signal
The Jefferies coverage said road freight tariffs rose 2% month on month in early September 2026, alongside higher fuel costs and preparation for seasonal demand. That is a reported market movement, not a nationwide government-mandated increase. On a hypothetical ₹10,000 freight charge, a 2% change is ₹200 before tolls, loading, port handling, insurance or last-mile costs. Actual contracts can differ by route, vehicle, cargo and fuel-surcharge terms.
For fleet operators, the practical question is how much of a quoted trip cost comes from diesel, tolls and time rather than treating a container-rate headline as the price of every truck journey. A route-specific estimate can be checked with the fuel cost calculator, while the toll charges and trip-cost calculator can keep highway fees separate from the freight quote.
Consumers may see indirect effects
Higher international container rates can raise the landed cost of imported parts, machinery, fuel-related equipment and consumer goods, but the pass-through is not automatic or immediate. Importers may absorb part of the increase, renegotiate contracts, change inventory timing or use a different route. A domestic truck trip may also have a different cost structure from the ocean leg.
For private vehicle owners, this is therefore not a new petrol or diesel price announcement. Retail fuel prices depend on oil-company pricing decisions, taxes, crude and currency conditions. Readers tracking those numbers should use the live India fuel-price pages rather than infer a pump-price move from container freight data.
What transporters and buyers should watch next
The next useful checkpoints are the Ministry's September cargo data, the direction of global container rates after the early peak-season bookings, and any change in road freight tariffs or fuel-surcharge clauses. Port users should also distinguish the ocean freight line from terminal handling, customs, inland haulage and toll costs when comparing a quote.
For a business moving goods from a port to a warehouse, the complete cost is a chain: ocean freight, port handling, road fuel, tolls, driver time and last-mile delivery. A change in one link can matter without changing the others. For a private driver, the reader takeaway is simpler: the August port growth signals strong logistics activity, while the freight-rate jump is a warning that transport costs can stay volatile even when fuel prices at the pump are unchanged.
Frequently asked questions
Does a 132% rise in container rates mean every truck trip costs 132% more?
No. The reported 132% comparison is for global container freight rates against February 2026. Domestic road rates, diesel costs, tolls and contract surcharges follow different benchmarks.
Does 7% port growth mean fuel prices will fall?
No. Port throughput measures cargo handled. It does not set petrol, diesel or CNG prices, and it does not guarantee lower logistics costs.
What should be checked in a freight quote?
Check whether the quote separately states fuel surcharge, tolls, port handling, container movement, loading and last-mile delivery. That makes it easier to compare two routes or suppliers without treating one combined number as the whole transport cost.
Sources
- Ministry of Ports, Shipping and Waterways, “Cargo Handling Status for Major Ports During August 2026” (24 Sep 2026)
- Ministry of Ports, Shipping and Waterways, “Cargo Handling Status for Non-Major Ports During August 2026” (24 Sep 2026)
- Maritime Gateway, “India’s port volumes rise 7% YoY in August as freight rates surge 132%: Jefferies” (24 Sep 2026)
- The Tribune, “India’s port volumes rise 7% YoY in August as freight rates surge 132%: Jefferies” (23 Sep 2026)