India’s rural vehicle market was stronger than urban markets in August 2026 even as tractor demand weakened amid uneven rains, according to FADA retail data cited in a fresh Business Standard report. Rural passenger-vehicle retail grew 24.9% year-on-year against 10.9% in urban markets, while rural commercial-vehicle and three-wheeler demand also outpaced their urban counterparts.
For Indian drivers, vehicle buyers and small transport operators, the result points to a broader rural mobility market rather than a story driven only by farm purchases. It also shows why the headline growth rate needs to be read alongside vehicle type, local income conditions, fuel choice and the difference between retail registrations and factory dispatches.
Key takeaways
- Rural passenger-vehicle retail grew 24.9% year-on-year in August, more than twice the 10.9% growth recorded in urban markets.
- Rural commercial-vehicle retail rose 16.3%, compared with 12.7% in urban markets, as goods movement, construction and other non-farm activity supported demand.
- Rural three-wheeler retail grew 23.9%, even as urban three-wheeler sales declined.
- Tractor retail moved differently: it was down about 25% month-on-month and was effectively flat year-on-year, showing pressure in the farm-linked segment.
- The next test is September to November, when festive showroom conversions will show whether August’s growth survives a stronger comparison base.
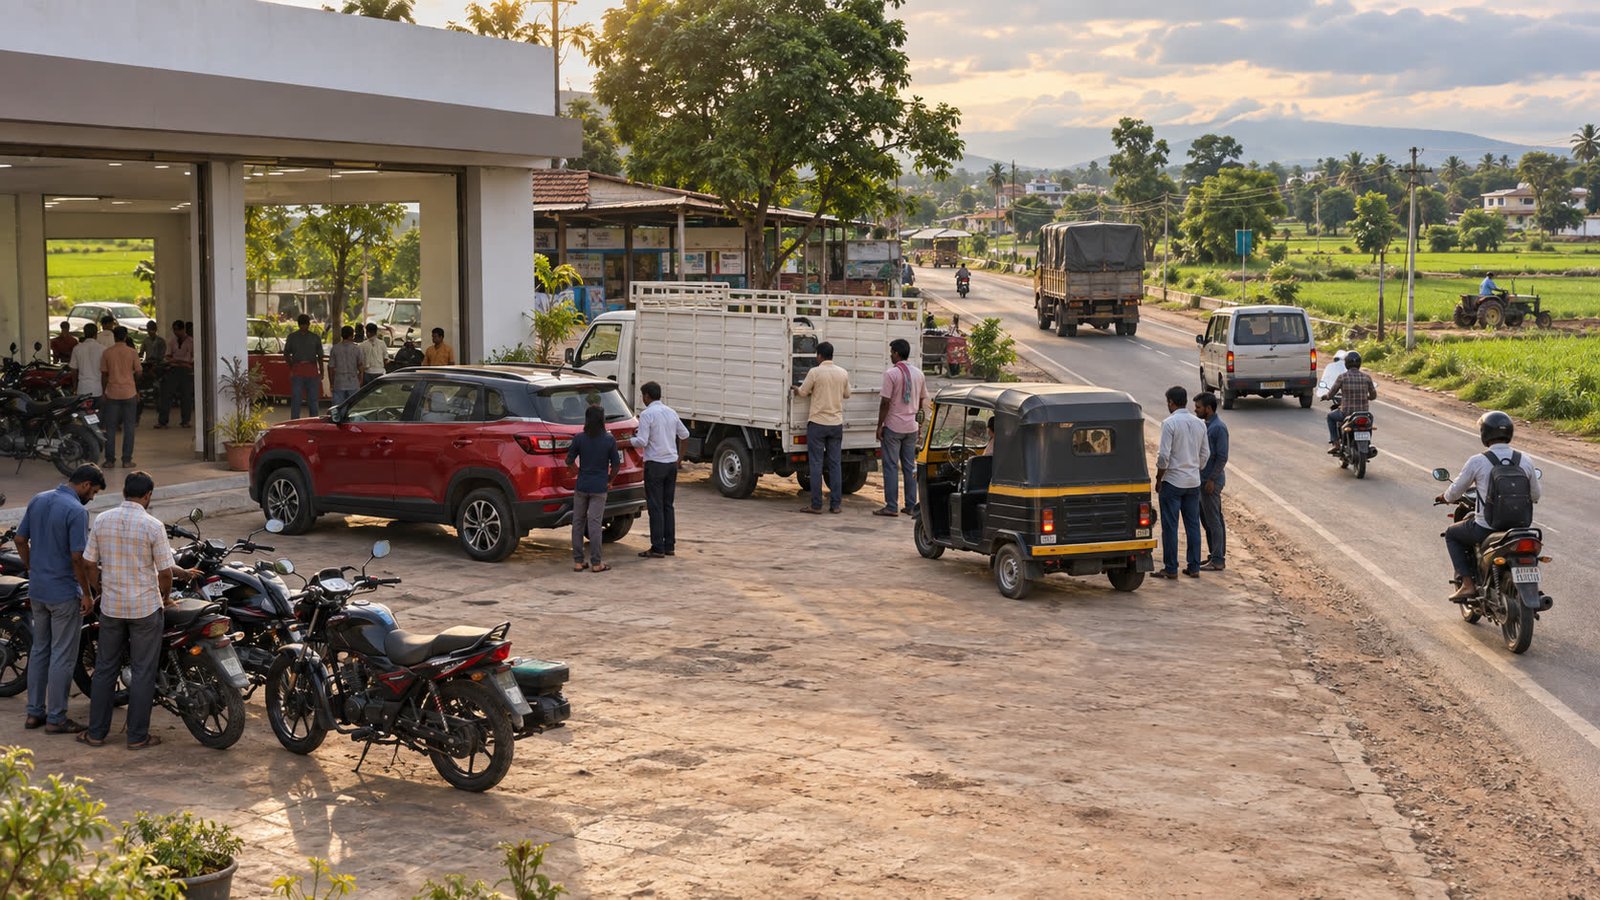
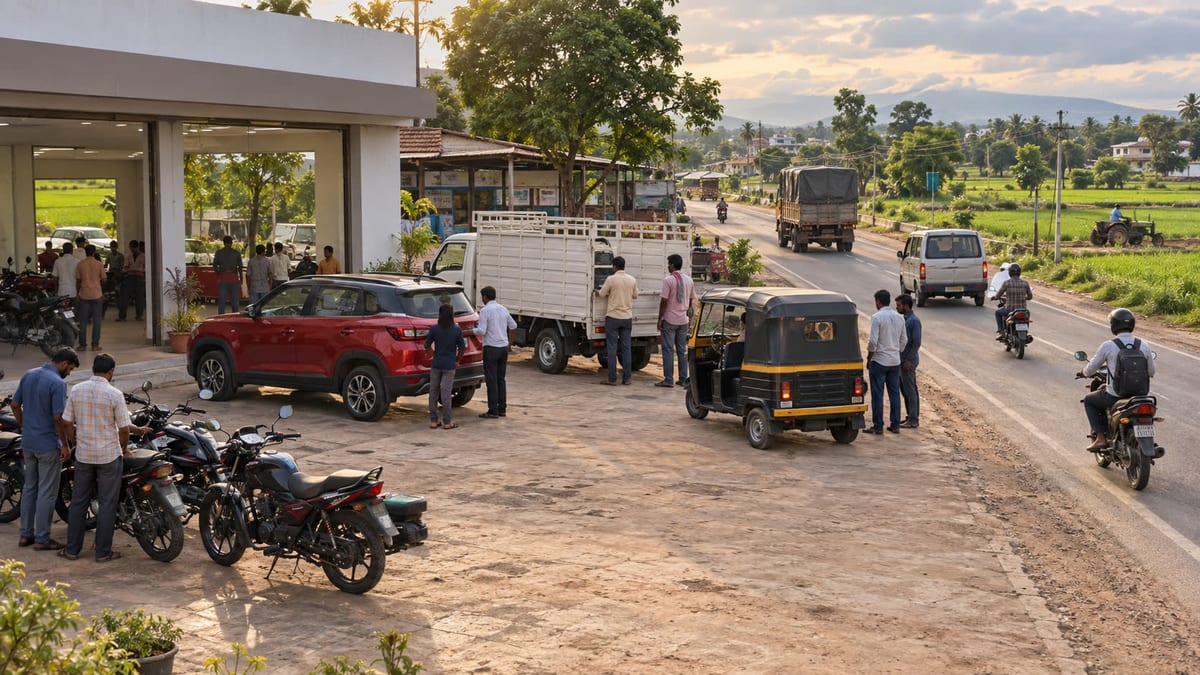 Credit: FuelPrice; AI-generated editorial illustration of mixed vehicle use in a rural market, not an official vehicle photograph.
What the August retail data shows
FADA’s August 2026 vehicle retail data records registrations at dealers rather than vehicles dispatched by manufacturers. That makes it useful for understanding what buyers actually took home during the month, while SIAM’s factory and wholesale data provides a different view of production and sales to dealers.
The clearest divide was in passenger vehicles. Rural retail grew 24.9% year-on-year, versus 10.9% in urban areas. This is a growth-rate comparison, not a claim that rural India sold more cars in absolute numbers than cities. Urban centres remain the larger market, but the rural rate shows that demand outside metros was adding more momentum to the category.
The commercial-vehicle picture was similar. Rural retail rose 16.3%, ahead of 12.7% in urban markets. The pattern is consistent with demand linked to local goods movement, construction, infrastructure work and e-commerce distribution, although the data alone cannot identify how much each activity contributed. For a small operator, a registration trend is not the same as guaranteed freight income; route utilisation, payload, fuel cost and service access still determine whether a vehicle is workable.
Three-wheelers showed the sharpest rural-urban contrast among the categories highlighted in the latest report. Rural retail grew 23.9%, while urban three-wheeler sales fell. That suggests last-mile passenger and goods mobility remained active in smaller towns and rural markets even as city demand softened. It is also consistent with the longer shift towards electric three-wheelers, but August registrations should not be treated as a forecast for every district.
Why tractor demand tells a different story
Tractors were the exception to the broader rural pattern. FADA’s August release showed tractor retail down 25.03% month-on-month and almost unchanged year-on-year. Business Standard reported the same direction, describing the category as more exposed to deficient rainfall and farm-linked purchasing than passenger, commercial and three-wheeler markets.
That split is important. A weak tractor month does not automatically mean rural households have stopped buying all vehicles. Non-farm work, local deliveries, construction and personal mobility can remain active even when farm sentiment is uncertain. At the same time, the data does not prove that rural demand has permanently separated from the monsoon. Crop output, farm prices, credit conditions and late-season rainfall can still change the picture.
What this means for buyers and operators
For passenger-vehicle and two-wheeler buyers
Rural growth across more than one category suggests that buyers are making mobility decisions for work, family travel and local commerce, not only for agricultural use. The relevant comparison is therefore the vehicle’s expected use over a month: distance, passengers or load, road conditions, fuel availability and after-sales support.
For a running-cost check, readers can use the fuel cost calculator with their own distance and mileage assumptions. Since rates vary by location and change over time, the result can be paired with the latest fuel prices rather than using a national average. Buyers considering an electric vehicle also need to check whether their regular routes have practical charging access through the EV charging directory.
For commercial-vehicle and three-wheeler operators
The rural commercial-vehicle and three-wheeler numbers are a signal of activity, not a promise of higher earnings. Operators assessing a replacement or expansion can separate the demand question from the ownership question: expected trips and payload on one side, and purchase cost, maintenance, insurance, tolls and energy on the other. A route that looks busy may still be unsuitable if return loads are weak or charging and repair support is distant.
The same caution applies to the three-wheeler data. Stronger rural registrations can reflect passenger services, goods carriage or local replacement demand, and the national number does not identify the mix in a particular town.
For manufacturers and dealers
The August data also carries an inventory warning. FADA’s wider August release put passenger-vehicle inventory at roughly 38–40 days, above its recommended 21-day level, with many dealers reporting higher stock month-on-month. That does not guarantee a discount or a particular offer, but it does show why headline retail growth should be checked against stock movement and actual showroom conversion.
What to watch through the festive period
FADA and the latest reporting point to September-November as the more meaningful test. Analysts will watch whether rural passenger-vehicle and commercial-vehicle growth continues after the monsoon, whether tractor demand improves with farm-income visibility, and whether the festive calendar converts bookings into registrations.
There is also a base-effect issue. August 2025 was a soft comparison period because some buyers delayed purchases while awaiting the GST 2.0 rate change. That can make year-on-year growth look stronger than the underlying trend. A better read will combine year-on-year growth with month-on-month movement, dealer inventory, model-level availability and the split between rural and urban markets.
Fuel mix is another practical watchpoint. The August data suggests that running costs and access to CNG, hybrid and electric options are influencing vehicle choices, but local infrastructure still matters. The rural market is not one market: a buyer near a major highway may face a different fuel and service choice from one in a smaller district.
Reader takeaway
August’s numbers show resilient rural demand across passenger vehicles, commercial vehicles and three-wheelers, even while tractors reflected weaker farm-linked conditions. For readers, the useful conclusion is not that one vehicle category is universally better; it is that national growth headlines need to be matched with the vehicle’s job, the route’s operating cost and the support available where it will be used. FuelPrice’s earlier coverage of rural two-wheeler registrations provides additional context on how non-metro mobility has been evolving.
Sources
- Business Standard — Rural India’s auto demand holds despite weak rains in August: FADA data (28 Sep 2026)
- Federation of Automobile Dealers Associations — August 2026 Vehicle Retail Data by Category (7 Sep 2026)
- City Air News — FADA Releases Aug’26 Vehicle Retail Data (7 Sep 2026)
- Autoguideindia — India auto retail sales up 17.51% in August 2026, FADA (7 Sep 2026)