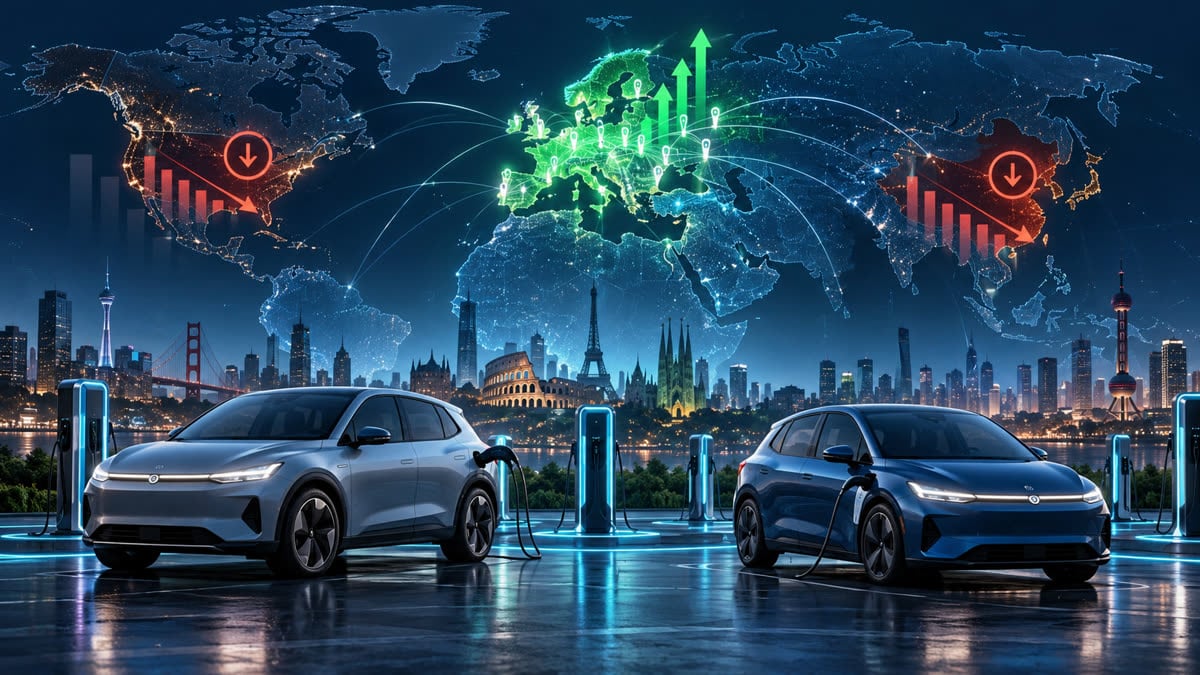
Global electric-vehicle sales fell 2% year on year to 2.15 million units in September 2026, ending six straight months of annual growth, according to Benchmark Mineral Intelligence data reported by Reuters. The headline decline masks a sharp regional split: Europe posted a record month, while North America and China fell, so the signal for EV buyers and automakers is uneven rather than a simple global retreat.
Key takeaways
- Benchmark recorded 2.15 million global EV sales in September, down 2% year on year; sales for the first nine months reached 15.5 million, up 3% from the same period in 2025.
- Europe had its strongest month on record, with almost 600,000 vehicles sold and a 39% year-on-year increase.
- North American sales fell 44% year on year, while China fell 18% to 1.11 million vehicles.
- The North American comparison is distorted by buyers bringing forward purchases before the United States federal EV tax credit expired in September 2025.
- The next useful test is the fourth-quarter data, when comparisons will be against the weaker post-credit period in North America.
What the September data shows
Benchmark Mineral Intelligence’s 16 October analysis counted 2.15 million electric vehicles sold worldwide in September 2026. That was 17% higher than August but 2% lower than September 2025. Its year-to-date total stood at 15.5 million vehicles, 3% above the comparable period a year earlier. Reuters reported the same assessment, and EV Infrastructure News separately published the same Benchmark figures on 16 October.
The difference between the monthly and annual comparisons matters. A 17% month-on-month rebound can coexist with a 2% year-on-year decline when the previous September was unusually strong. The global total therefore says the market paused against a high base; it does not, by itself, prove that electric mobility has entered a worldwide collapse.
| Market | September 2026 result | What it indicates |
|---|---|---|
| Global | 2.15 million sales; 2% lower year on year | A softer annual comparison after six months of growth |
| Europe | Almost 600,000 sales; 39% higher year on year | Record regional momentum supported by demand and policy |
| North America | 44% lower year on year | A high September 2025 comparison before the US credit ended |
| China | 1.11 million sales; 18% lower year on year | Weaker domestic demand is pushing manufacturers to seek more export volume |
Why Europe is carrying the global signal
Europe was the clearest positive in the release. Benchmark said the region’s September sales were 10% above its previous monthly high set in June 2026. Battery-electric vehicles led the increase, while plug-in hybrids also grew, and the rise was spread across several major markets rather than being limited to one country.
Reuters linked Europe’s strength to consumer demand and policy support. That combination is important for automakers: purchase incentives, company-car taxation, emissions rules and charging availability can change the pace of adoption even when global vehicle demand is not moving uniformly. The data also shows why a single worldwide growth rate can hide the conditions that actually shape a driver’s local market.
Why North America’s fall needs careful reading
The 44% North American decline is the largest regional drop in the September comparison, but Benchmark says it mainly reflects the unusually strong base created in September 2025. Buyers in the United States brought forward purchases before the federal EV tax credit expired at the end of that month. That timing pulled demand into the earlier comparison period.
From October 2026, the region will be compared with the first months after the credit’s removal, when EV sales had already fallen sharply. Benchmark expects the year-on-year comparison to improve markedly from the fourth quarter. That is a statistical effect, not a promise that every North American market or vehicle brand will immediately recover.
China’s weakness is also a market-mix story
China’s September sales fell 18% year on year to 1.11 million vehicles, according to the Benchmark figures reported by Reuters. The decline widened from August even as month-on-month sales rose, which again shows why the direction depends on the comparison used.
The reports describe weaker domestic demand and growing reliance on exports by Chinese manufacturers. For buyers in other countries, that can mean more internationally available models and more competition on equipment and pricing. It does not mean every exported vehicle will be cheaper, or that supply will arrive in every market; tariffs, approval rules, shipping costs, dealer networks and local incentives still determine what consumers can actually buy.
What the split means for drivers
EV sales data is not an immediate price list. It does not set a vehicle’s retail price, the fee at a charging point or the cost of electricity on a particular route. It does, however, provide context for availability, model launches and the pace at which manufacturers are allocating vehicles to different countries.
For someone comparing an electric vehicle with a petrol or diesel vehicle, the useful local questions remain practical: where can the vehicle charge, how long does a typical stop take, and what does a regular trip cost? FuelPrice’s EV charging directory can help locate charging options, while the fuel-cost calculator can provide a like-for-like running-cost estimate for a planned journey.
Existing combustion-vehicle owners should not treat the global EV decline as a direct signal for petrol or diesel prices. Those prices follow crude markets, refining, taxes and local pricing decisions. Current rates can be checked through the live fuel-price tracker, separately from the EV sales data.
What automakers and policymakers will watch next
The fourth-quarter data will be especially important because North America’s comparison base becomes less abnormal. Europe will show whether September’s record reflects a durable shift or a strong registration month. China will be watched for evidence that domestic demand is stabilising and for the balance between local sales and exports.
Automakers will also be watching charging deployment, battery costs, incentives and trade rules. A global sales total can rise while one region contracts, or fall while another reaches a record. Production, vehicle allocation and investment decisions therefore need to be made market by market rather than from the worldwide percentage alone.
Readers tracking fuel, transport and energy developments across markets can follow the worldwide fuel news archive as the next regional data releases arrive.
Reader takeaway
September’s 2% global EV sales decline is a real year-on-year setback, but it is not a uniform worldwide demand signal. Europe is expanding strongly, North America is still normalising after a tax-credit-driven comparison spike, and China is balancing a softer home market with greater export pressure. For drivers, local charging access, vehicle availability and trip cost remain more useful decision inputs than the global headline alone.
This article is for general information only and is not financial, insurance or legal advice.
Sources
- Benchmark Mineral Intelligence: “Global EV sales reach 2.15 million units in September 2026” — 16 October 2026.
- Reuters, via Investing.com: “Global EV sales fall 2% in September, ending six-month growth streak” — 16 October 2026.
- EV Infrastructure News: “EV sales hit 2.15 million in September, down 2% year-on-year” — 16 October 2026.